


Most investors treat the Federal Reserve’s interest rate decisions like a spectator sport, but by the time the headlines hit your phone, the smart money has already moved on. With the national debt blasting past $40 trillion and the Fed funds rate sitting at 3.63%, mastering market macro analysis for investors is no longer optional; it’s a survival skill. It’s easy to feel paralyzed by information overload when you’re trying to connect a 3.36% inflation print to a specific butterfly spread or a protective hedge. You know the big shifts are coming, but the bridge between a GDP report and an actionable profit target often feels broken.
We’re going to fix that. This guide moves beyond the noise to give you a clear, repeatable system for identifying market cycles before they’re common knowledge. You’ll learn how to translate complex economic data into high-probability strategies that protect your capital while others are panic-selling. We’ll explore the specific methodology for spotting opportunities in the shift toward AI infrastructure and higher-for-longer yields, ensuring you have the confidence to act when the herd is still checking their notifications.
Key Takeaways
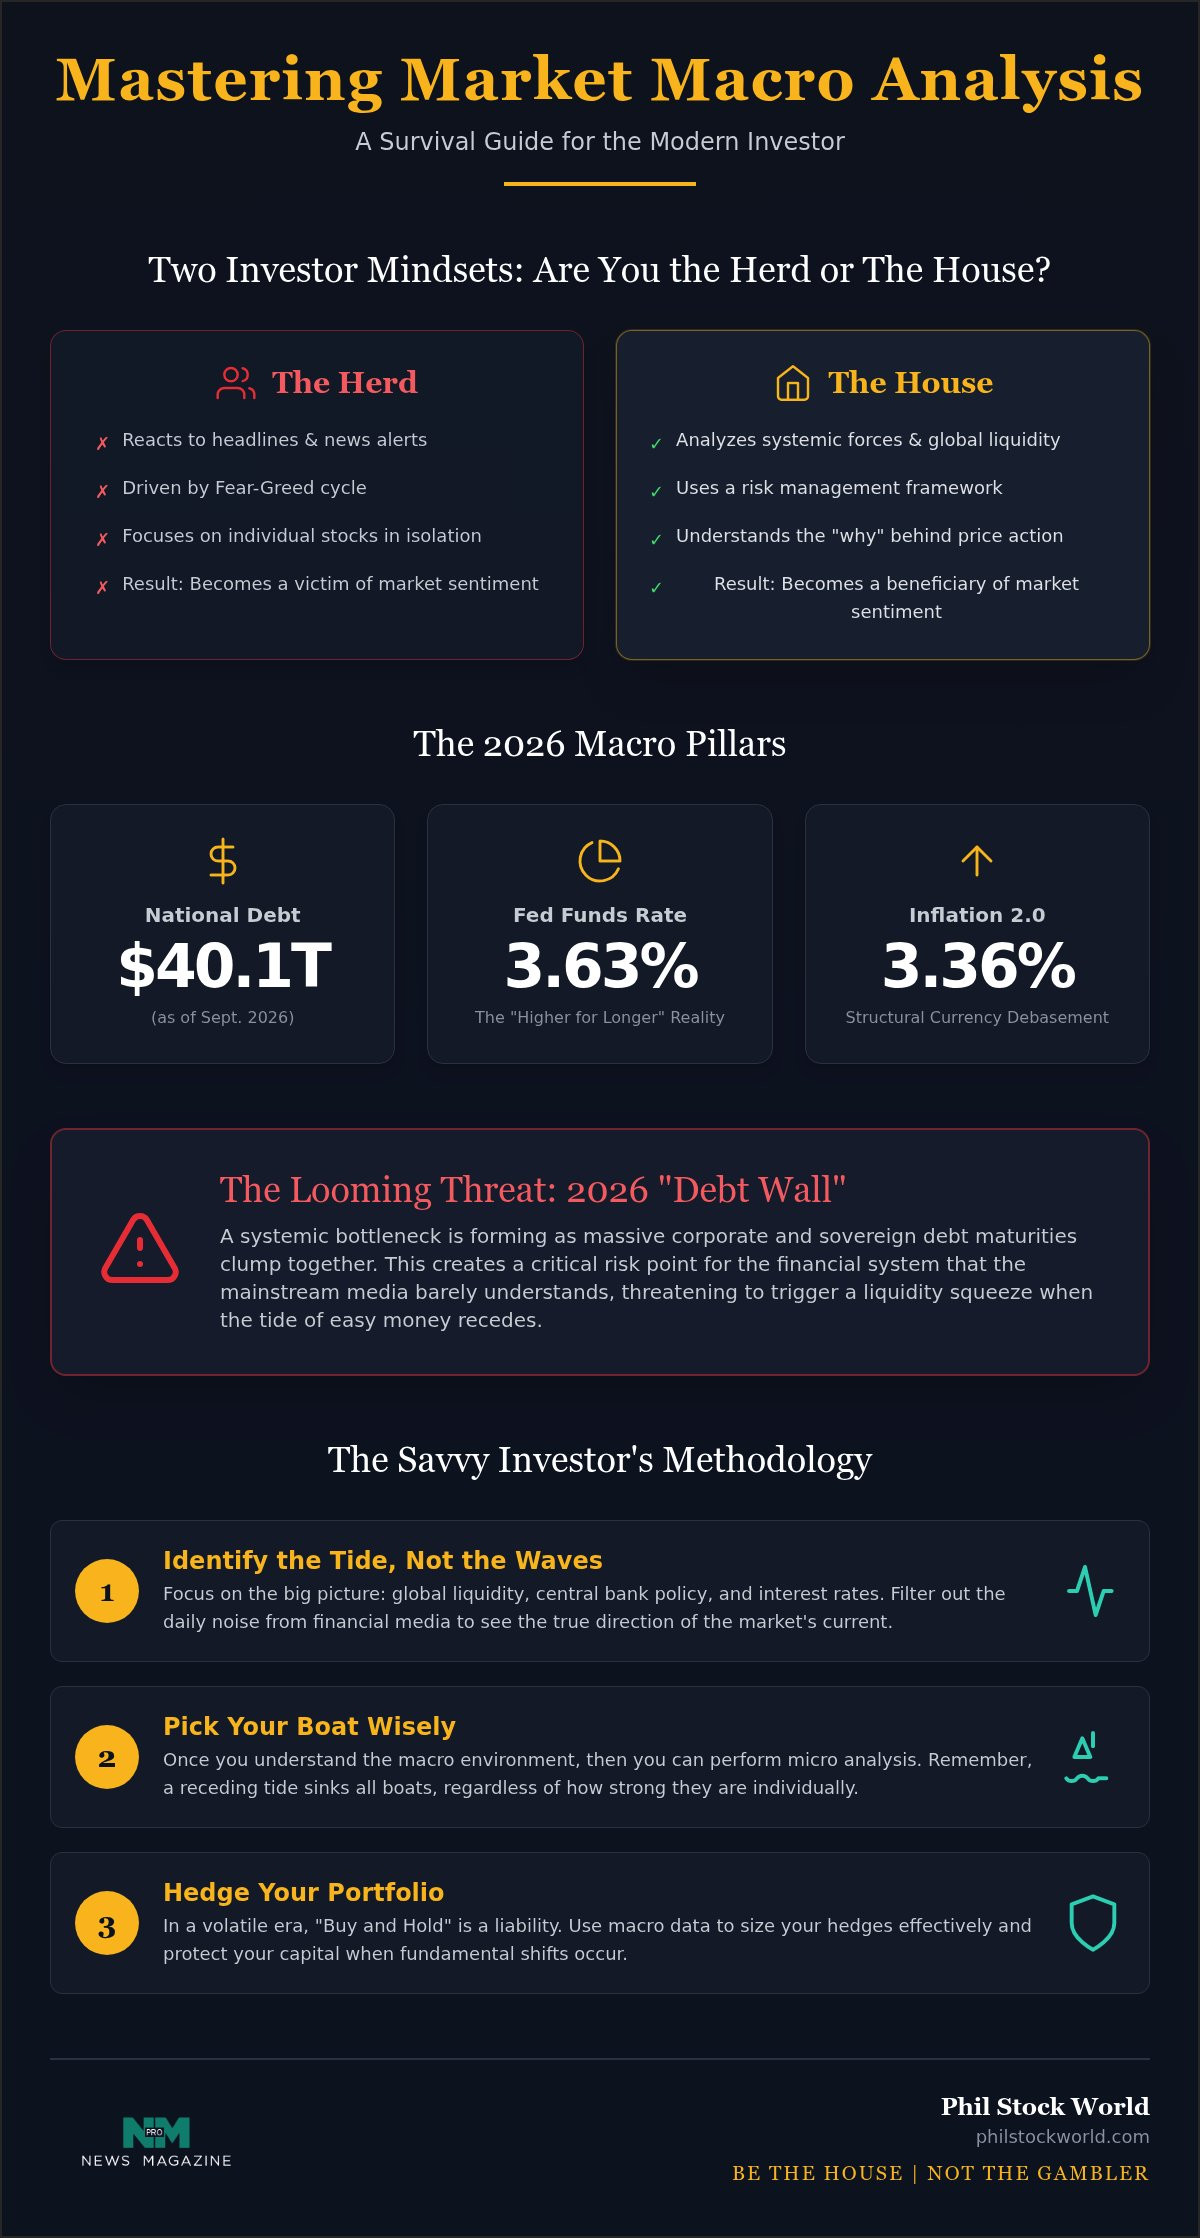
- Stop chasing headlines and start analyzing the systemic forces that drive global liquidity to trade like “The House” rather than the retail herd.
- Master market macro analysis for investors to navigate the 2026 “Debt Wall” and separate the noise of lagging indicators from the signals that dictate market direction.
- Learn why the traditional buy and hold strategy is a liability in a volatile era and how to use macro data to size your hedges effectively.
- Leverage the power of independent research and a live trading community to spot high-probability setups before the mainstream media even notices a shift.
What is Market Macro Analysis and Why Does the Mainstream Get It Wrong?
Macro analysis isn’t about staring at a crystal ball to find the next “ten-bagger” tech stock. It’s the study of systemic forces like global liquidity, central bank policy, and interest rates that dictate the environment where your stocks live. Think of it as the weather report for your portfolio. If a hurricane is coming, it doesn’t matter how great your house is; you need to board up the windows. Real market macro analysis for investors is about understanding the “why” behind the price action, rather than just reacting to the “what.”
Mainstream financial media gets this wrong because they focus on the “Herd” mentality. They react to a headline about a 3.36% inflation rate as if it’s a total shock, while the savvy players, the ones we call “The House,” have already priced in the shift months ago. This analysis serves as a risk management framework, not a stock-picking tool. It tells you when to be aggressive and when to move to the sidelines. When you understand the macro landscape, you stop being a victim of market sentiment and start becoming a beneficiary of it.
The Big Picture: Why Micro Analysis Isn’t Enough
You can find the most undervalued company on the planet, but if the Federal Reserve is draining liquidity to combat a $40 trillion national debt, that stock is likely going down anyway. Micro analysis looks at the company’s engine, but macro analysis looks at the road. In 2026, the connection between global liquidity and asset price inflation is tighter than ever. When the tide of liquidity recedes, it sinks all boats, regardless of how strong their individual balance sheets look. This is the first step in the PSW Methodology: identify the tide before you pick the boat.
Mainstream Media vs. Savvy Analysis
Financial news networks survive on the “Fear-Greed” cycle. They need you emotional because emotional traders watch more ads. Most of the “expert” commentary you hear is just paid-to-play research designed to keep the retail herd moving in the wrong direction. To be successful, you need to understand every economic indicator not as a standalone fact, but as a piece of a larger puzzle. Macro analysis is the filter that separates structural shifts from temporary noise. By looking past the shouting heads on TV, you can spot the difference between a minor market hiccup and a fundamental change in the economic landscape that requires a Virtual Portfolio Review to ensure you aren’t overexposed.
The 2026 Macro Pillars: Interest Rates, Inflation, and the Debt Wall
As we move deeper into 2026, the economic landscape is dominated by three massive pillars: interest rates, structural inflation, and the looming “Debt Wall.” Effective market macro analysis for investors means understanding that the easy money era didn’t just end; it evolved into a high-stakes game of musical chairs. With the national debt hitting $40.10 trillion in September 2026, the cost of servicing that debt is no longer a footnote. It’s the headline. We’re seeing a fundamental shift where corporate and sovereign debt maturities are clumping together, creating a systemic bottleneck that the mainstream media barely understands. This isn’t just about numbers on a screen. It’s about the physical reality of how much weight the financial system can carry before something snaps.
Geopolitical shifts are further complicating this picture. As trade alliances fracture and tariffs become a standard tool of foreign policy, the U.S. Dollar’s role as the undisputed reserve currency is facing its most significant test in decades. We’re moving into an “Inflation 2.0” phase. Unlike the temporary supply chain shocks of years past, this is structural currency debasement driven by massive fiscal deficits and a global scramble for resources. To survive this, you have to distinguish between the noise of a bad news cycle and the signal of a structural shift in global trade.
The Federal Reserve’s New Playbook
The Fed has settled into a baseline where the effective funds rate sits around 3.63%. This isn’t the zero-interest world of the past decade. It’s a “Higher for Longer” reality that forces companies to actually be profitable rather than just living on cheap credit. To understand where we’re going, you need to decode the Fed’s balance sheet management. When they trim the fat through quantitative tightening, liquidity dries up in the corners of the market where the herd likes to play. Reading the dot plot isn’t just for academics; it’s how professional traders anticipate where the next liquidity squeeze will happen before it hits the tape.
Fiscal Policy and the Liquidity Trap
Government spending continues to crowd out private sector investment, leading us toward a potential liquidity trap. This happens when even relatively stable interest rates fail to stimulate growth because everyone is too busy paying off old debt to take on new projects. The 2026 debt cycle creates a forced volatility environment where markets swing wildly based on the government’s ability to roll over its massive obligations. While the official Measuring the Economy: A Primer on GDP provides the raw numbers, it doesn’t tell you how to trade the fallout. Real world experience is the only thing that bridges that gap. If you want to see how these macro pillars translate into actual trades, checking out our daily Market Charts and Analysis is the best way to stay ahead of the curve.
Decoding Economic Indicators: Distinguishing Signal from Noise
Most retail traders wait for the monthly unemployment report to tell them the economy is in trouble. That’s like waiting for a divorce decree to realize your marriage is on the rocks. Unemployment is a classic lagging indicator; by the time it spikes, the market has already bottomed and started its next leg up. Effective market macro analysis for investors requires a shift in focus toward data that actually moves the needle before the news hits the tape. We’re looking for the “check engine” lights of the global economy, not the wreckage in the rearview mirror.
Take the Consumer Price Index (CPI), which sat at 3.36% in August 2026. While the mainstream media obsess over the decimal points, savvy traders use it as a gauge for market sentiment. It tells us how much “pain” the Fed is willing to tolerate before they pivot. When you combine these domestic prints with the broader projections found in the IMF’s World Economic Outlook, you start to see the structural shifts in global trade that others miss. Manufacturing and Services PMIs act as our early warning system; when these dip below 50, the “soft landing” narrative usually starts to crumble. The yield curve inversions we’ve tracked through 2026 provide the definitive roadmap for the 2027 outlook, signaling exactly where the liquidity traps are laid.
Leading Indicators You Should Actually Watch
If you want to know where the economy is going, look at Housing Starts and Building Permits. These are the first dominoes to fall because they represent long term capital commitments. Similarly, the Baltic Dry Index offers a raw look at global trade health by tracking the cost of moving raw materials. It’s much harder to fake shipping costs than it is to massage a government jobs report. Finally, keep a close eye on the M2 Money Supply. It’s the ultimate precursor to asset moves; when the taps are turned off, the party in equities usually ends shortly after.
Sentiment Analysis: The Footprints of the Herd
The “Herd” always leaves footprints, and you can find them in the sentiment data. The VIX, or “Fear Gauge,” tells us when the retail crowd is paralyzed by panic, which is often the exact moment “The House” starts buying. Put/Call ratios serve as a brilliant contrarian indicator; when everyone is buying protection, the downside is often already priced in. To see these concepts in action, you can learn how to read market charts and start identifying these structural shifts in real time. Understanding the macro signal allows you to ignore the headline noise and focus on the high-probability setups that the mainstream simply isn’t equipped to see.
From Analysis to Action: Hedging Your Portfolio Against Macro Risks
The “Buy and Hold” mantra was a great strategy when money was free and the national debt wasn’t hurtling toward $41 trillion. In 2026, passive investing is a dangerous gamble. With the Fed funds rate holding steady at 3.63%, the cost of capital has fundamentally shifted, making market macro analysis for investors the difference between a growing portfolio and a stagnant one. You can’t just sit on your hands and hope for the best while structural inflation eats your real returns. Real traders act like “The House” by using volatility to their advantage, rather than being victimized by it.
Hedging isn’t just about buying insurance; it’s about strategic position sizing based on the macro climate. When our analysis shows global liquidity is drying up or the “Debt Wall” is approaching a critical maturity window, we increase our protection. We don’t wait for a 20% drawdown to start thinking about safety. Instead, we sell premium when the retail herd is panicking. By collecting the high volatility premiums that scared investors are desperate to pay, you effectively lower your cost basis and create a “synthetic” floor for your assets.
The Art of the Protective Put
Timing your protection is a matter of reading macro signals rather than staring at a one minute candle. When leading indicators like Housing Starts begin to soften, it’s time to price out your insurance. Selecting the right strike price requires a blend of technical levels and macro floors. Here’s a quick guide to getting it right:
- Identify Macro Support: Look for major price levels where the Fed has historically stepped in or where significant liquidity sits.
- Select Your Strike: Choose a strike price 5% to 10% below the current market price to protect against a “black swan” event without overpaying for the premium.
- Duration Matters: Match your put expiration to the macro event window, such as an upcoming CPI release or a Fed meeting.
Sector Rotation Strategies
The 2026 economic cycle demands a move away from speculative growth and toward sectors with “hard” value. As interest rates stay higher for longer, companies with heavy debt loads will struggle, while cash-rich firms and infrastructure plays will thrive. We’re seeing a massive rotation into energy and commodities as structural currency debasement continues to devalue the dollar. To execute these moves with precision, you should study advanced option trading strategies that allow you to profit from sector shifts without committing massive amounts of capital. If you aren’t sure if your current holdings can survive the next macro shift, a Virtual Portfolio Review is the smartest way to audit your exposure before the market does it for you.
The Phil Stock World Edge: Macro Insights for Independent Traders
Wall Street research is often just marketing dressed up in a suit. They want you to stay invested so they can collect fees, regardless of whether the macro tide is turning against you. Independent market macro analysis for investors isn’t about following the herd; it’s about finding the cracks in the mainstream narrative. At Phil Stock World, we don’t care about being polite to the big banks. We care about what works. This skeptical perspective is essential when the national debt sits at $40.10 trillion and the Fed is managing a delicate balance. We translate high-level economic shifts into actionable ideas you can actually trade.
Beyond Static Research: The Live Trading Room
Reading a report is one thing, but watching a macro theory play out in real-time is where the real education happens. The Live Trading Room is where we filter the daily noise. When a surprise CPI print hits or a geopolitical event shakes the markets, our community doesn’t panic. We discuss. We analyze. We look for the “House” side of the trade. It’s a high-level peer environment where discipline beats emotion every single time. You need more than just static articles or generic financial news portals. You need a responsive, street-smart network to survive a volatile 2026.
Your 2026 Macro Audit
Success in this environment requires a cold, hard look at your current holdings and a solid foundation in market macro analysis for investors. Most individuals are accidentally overexposed to macro risks they don’t even see. Our virtual portfolio review is designed to fix that. We audit your strategy against the 2026 market environment, checking for interest rate sensitivity and structural inflation protection. It’s about building a disciplined approach that ignores the media hype and focuses on high-probability execution. Don’t let the next market shift catch you off guard. It’s time to stop guessing and start trading with a plan. Join Phil Stock World and trade like the house today.
Mastering the Macro Tide in 2026
Success in the current market isn’t about having a faster news feed; it’s about having a better filter. We’ve explored how systemic forces like the $40.10 trillion national debt and structural inflation require a fundamental shift in how you protect your capital. By focusing on leading indicators and mastering market macro analysis for investors, you can transition from reacting to headlines to anticipating structural shifts. Hedging is no longer a luxury. It’s the foundation of a strategy that prioritizes capital preservation while the retail herd remains paralyzed by volatility.
You don’t have to navigate these global shifts alone. Since 2006, veteran trader Phil Davis has helped independent investors look past the mainstream echo chamber to find high-probability opportunities. Through real-time trade alerts and live trading rooms, we focus on the “House” side of the trade, emphasizing risk management over social media hype. It’s time to build a portfolio that survives any economic storm. Stop following the herd and start trading like “The House”: join Phil Stock World today. Your 2026 strategy starts with the confidence to act when others are merely watching.
Frequently Asked Questions
What is the most important macro indicator for investors in 2026?
The most critical indicator for 2026 is global liquidity, specifically the cost of servicing the $40.10 trillion national debt. While the Fed Funds Rate sits at 3.63%, the real story is how the “Debt Wall” of corporate and sovereign maturities affects market stability. Investors need to watch the M2 money supply and net liquidity injections. These forces dictate whether the tide is coming in or going out for your portfolio. Mastery of market macro analysis for investors starts with tracking these flows.
How does macro analysis differ from technical analysis?
Macro analysis studies the systemic forces like interest rates and fiscal policy that create the market’s environment. Technical analysis looks at the chart’s price action to find the footprints of the herd. Think of macro as the weather report and technicals as the tracks in the snow. You use macro to decide if you should be in the woods and technicals to decide which path to take. Both are essential, but macro provides the “why” behind the move.
Can macro analysis help me time my entry into the stock market?
Macro analysis is excellent for identifying major cycle pivots and broad entry windows. It won’t tell you the exact minute to buy a stock, but it will tell you when the risk/reward profile has shifted in your favor. By monitoring leading indicators like Housing Starts or PMI data, you can spot the end of a contraction before the mainstream media catches on. This allows you to enter positions before the herd reacts to the news.
Is macro analysis only for long-term investors or can traders use it too?
Traders use market macro analysis for investors to ensure they aren’t fighting the primary trend of the economy. Even if you’re day trading, knowing that a $40 trillion debt wall is causing a liquidity squeeze helps you avoid bull traps. Understanding the macro backdrop provides the necessary context for your short term setups. It turns a speculative guess into a high probability trade by aligning your timeframe with the broader economic momentum.
How does the Federal Reserve’s interest rate policy affect my options trades?
The Fed’s policy directly impacts option premiums through interest rate sensitivity, known as Rho, and overall market volatility. With the current rate at 3.63%, the cost of carry for long positions is higher than in previous years. High interest rates often lead to higher implied volatility, which makes selling premium a more attractive “House” strategy. We use these macro shifts to determine whether we should be net sellers or buyers of options to maximize our probability of success.
What happens if the macro data contradicts the stock market’s current trend?
When macro data and market trends diverge, it usually means the herd is operating on emotion rather than math. This creates a “rubber band” effect where the market eventually snaps back to the fundamental reality. We look for these disconnects to set up contrarian hedges. If the S&P 500 is hitting new highs while liquidity is draining and debt is spiking, it’s time to increase your protective puts and wait for the inevitable correction.
How much time should I spend on macro analysis every week?
You don’t need to spend forty hours a week staring at spreadsheets to be effective. Spending two to three hours on deep research into weekly data releases like CPI or GDP is usually enough to maintain a clear worldview. The key is consistency rather than volume. Daily check-ins in a live trading room help you filter the noise and stay focused on the structural shifts that actually move the needle for your portfolio.
Why do mainstream financial analysts often get macro predictions wrong?
Mainstream analysts often operate in an echo chamber where they are incentivized to keep the retail herd invested. They rely heavily on lagging indicators like unemployment, which tells you where the economy was, not where it’s going. Many of these experts are “paid-to-play,” meaning their research is designed to support the bank’s corporate interests. Independent traders succeed by ignoring these biased narratives and focusing on the raw data that dictates global liquidity.

