

7,670!
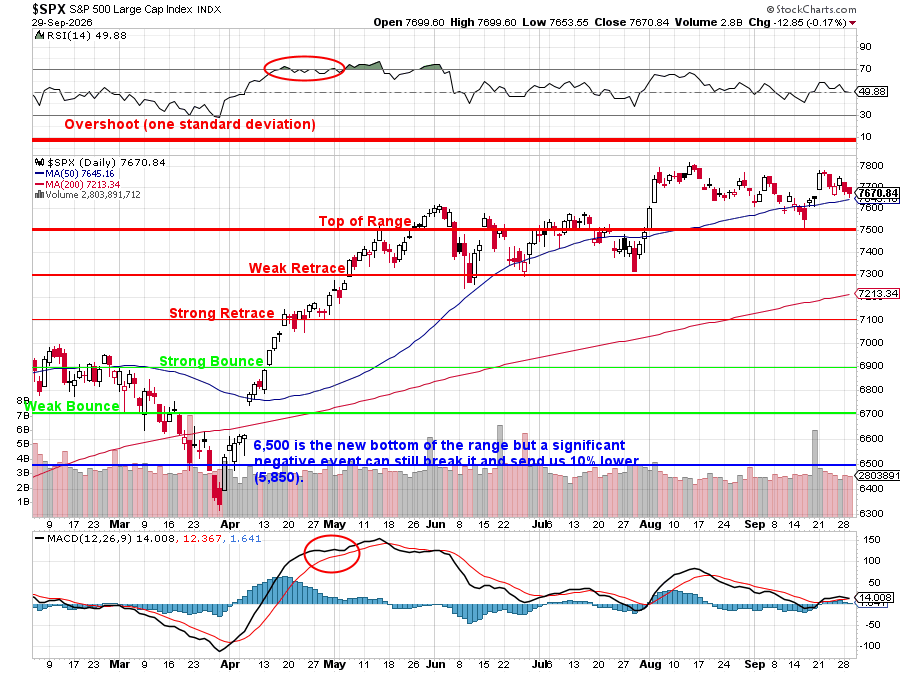
That’s 25 points over the 50-day moving average (7,645) and we’d BETTER hold that line or it’s a long way (5.9%) to the 200-day moving average at 7,213. We started the quarter at 7,500 – and that was the “top” of our expected range so these are, in fact, 170 (2.2%) bonus points we’ve been playing with in the past 90 days and our Member Portfolio adjustment already reflect the fact that we DO expect to test that 200-day moving average into Earnings Season.
October 13th is a week from Tuesday and our Big Bank Theory is that Q3 will disappoint – as will outlook for Q4 with rates so high and defaults climbing and that will be the first time since January 15th, when the major banks kicked off earnings season and Bank of America, Citigroup, JPMorgan, and Wells Fargo all fell short of expectations; their shares declined. Wells Fargo’s shortfall was tied in part to weak mortgage lending amid a slow housing market.
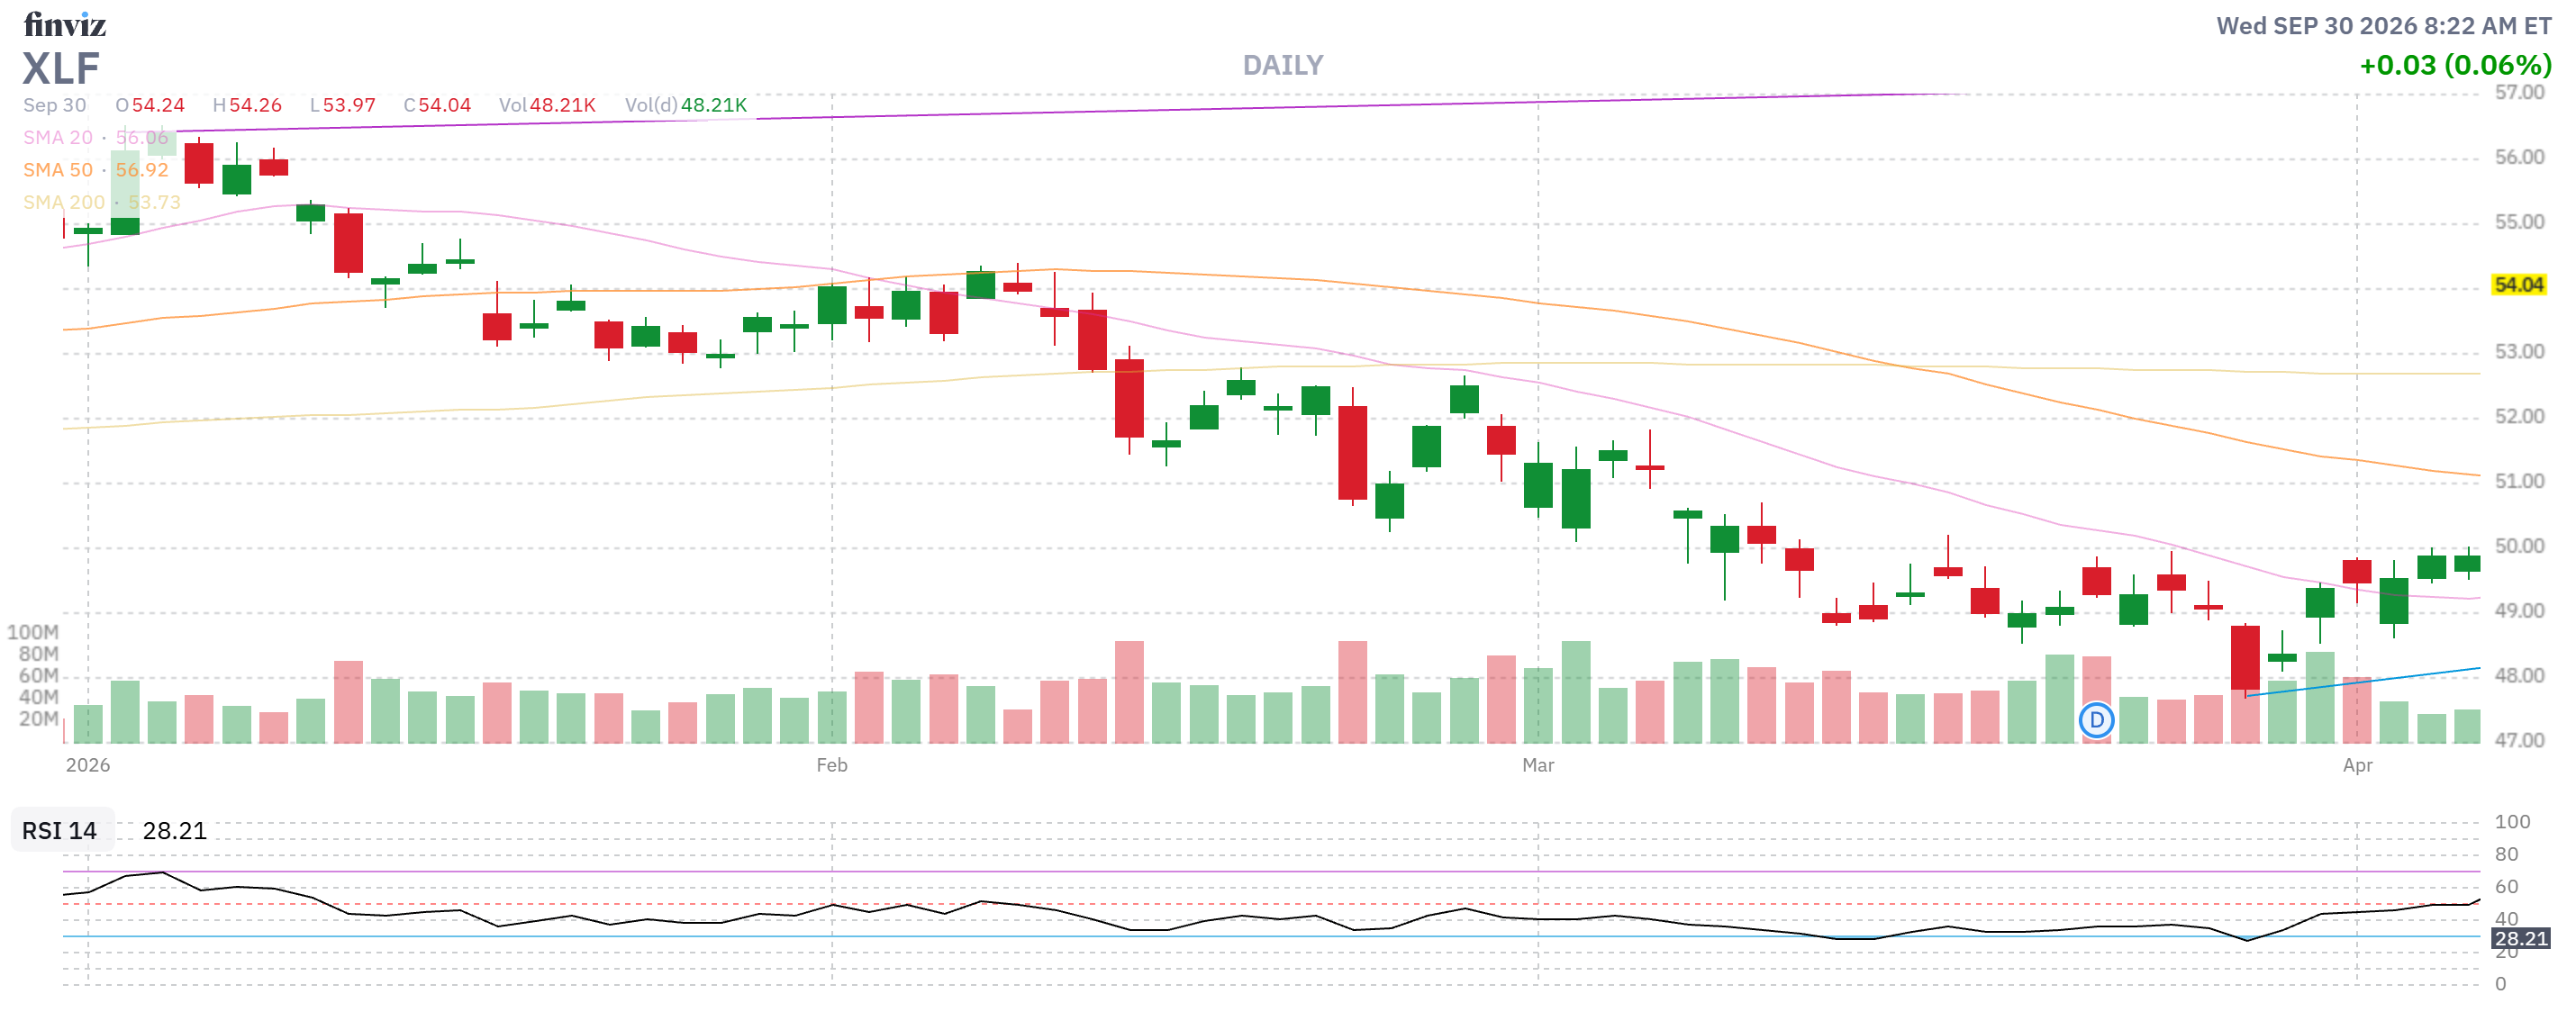
The evidence has been piling up all quarter:
-
-
Bank of America CEO Brian Moynihan said Q3 sales-and-trading revenue would be roughly flat year over year and guided investment-banking fees to $1.6B–$1.8B, down from $2B in Q3 2025.
-
Goldman CEO David Solomon then said FICC was “a little softer on a relative basis” in Q3, while its investment business would be “much more muted” following unusually strong Q2 activity.
-
Goldman also flagged roughly $500M of sequential non-compensation expense growth, partly from technology investment.
-
Goldman’s shares fell nearly 4% immediately after those comments and had already been weighed down by the BofA warning and the hawkish-rate environment.
-
-
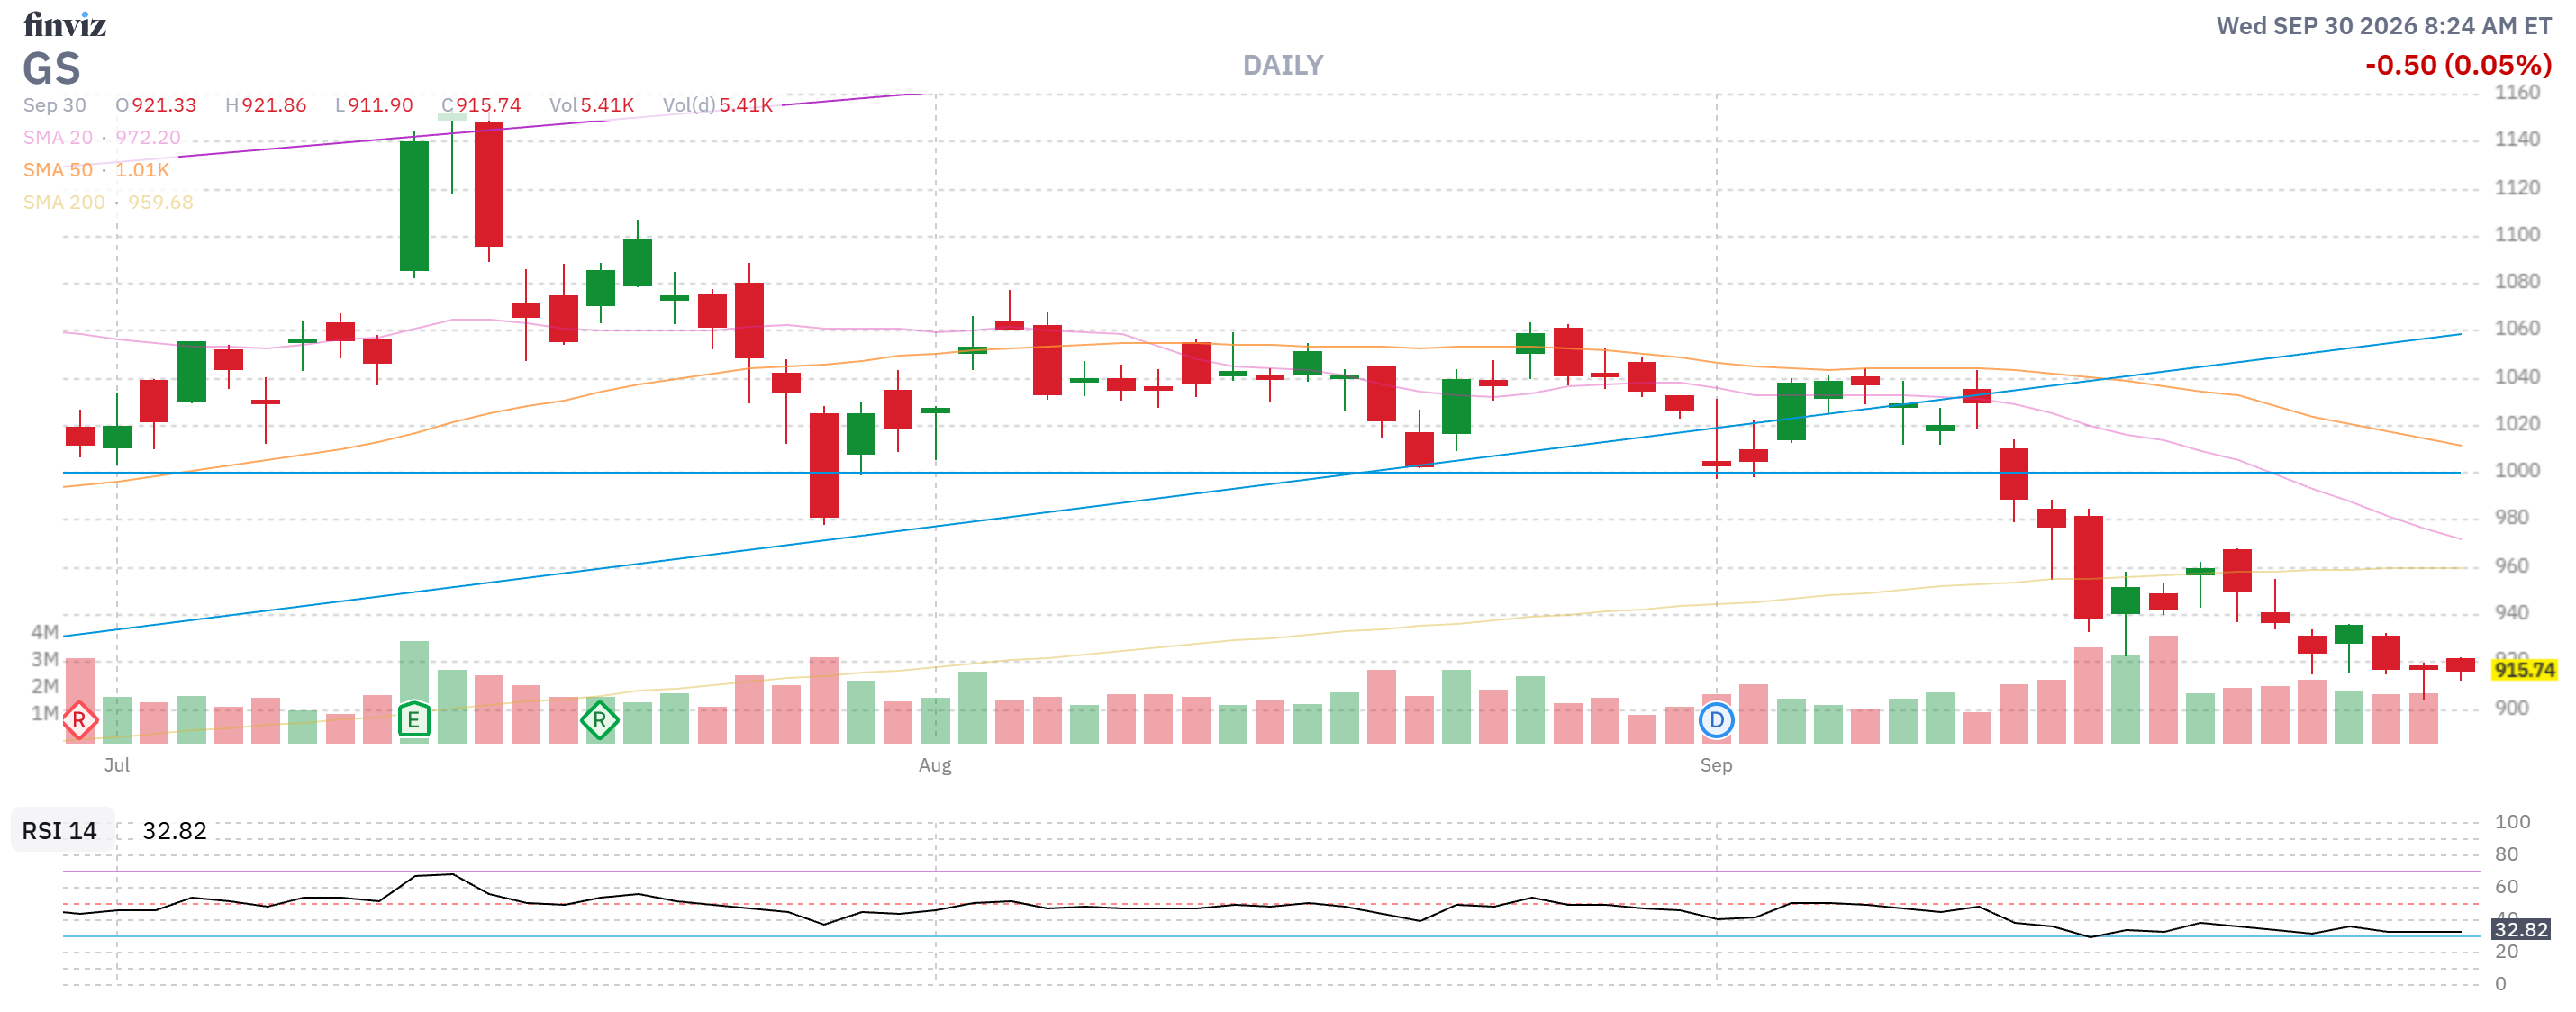
That is not PROOF of a banking-system crisis – it is, however, a warning that consensus may have annualized an unusually strong Q2 in markets and deal activity just as Q3 cooled.
🚢 What October 13 could reveal
The major-bank reports can disappoint the market in four distinct ways:
This uncertainty led us to get out of OZK in the Money Talk Portfolio yesterday as we can’t adjust the portfolio again until the next time we’re on the show in December (with our 2027 Trade of the Year announcement – time flies!).
Today, however, is the last day of the month and we SHOULD get some window-dressing despite the $90 Oil headline ($97.50 for Brent). As Oil and the War are the underlying economic driver going into Q4, I’ve asked Sancho (SUPER Intelligence!) to put together a status report for us:
 Good morning. Phil’s instinct is correct – the corporate media narrative is doing real work here, but it’s built on a foundation that is partially true and being stretched well past what the data actually supports. Let’s examine it properly:
What’s Actually True
Iran’s economy is genuinely suffering. These numbers are real and independently verified:
Al Jazeera’s September 21 GDP analysis confirmed Iran’s GDP contracted 10.1% year-over-year in Q1 of the Persian calendar year. Iranian crude loadings collapsed from 2 million bpd in March to 220,000-255,000 bpd in August. The rial hit a new record low this week – 2.5 million rials to the dollar, down from 2.2 million just 27 days earlier. Reuters’ September 29 human interest piece documented ordinary Iranians unable to afford rent, medicine and cigarettes. The IRGC is insulated; the civilian population is not. [aljazeera][reuters]
The naval blockade has genuinely worked where sanctions historically failed. That’s real.
What’s Being Spun
“Iran is losing its grip on Hormuz” – Fox News headline today
Al Jazeera’s September 30 analysis directly addresses this and reaches the opposite conclusion from Fox. Yes, traffic through Hormuz has increased to nearly 80% of pre-war levels per tanker trackers – but Al Jazeera’s analysts make the critical point: Iran hasn’t lost control, it has chosen to allow more traffic as a negotiating gesture while keeping its ability to shut it down intact. There’s a significant difference between “Iran can’t stop ships” and “Iran is strategically permitting more ships while talks are active.” The IRGC can re-mine or re-blockade at will. That option hasn’t gone anywhere. [aljazeera]
The NY Post’s “US says Iran is exhausted” story
The NY Post piece sourced entirely to anonymous “US officials” saying Iran is “running on fumes” and “exhausted.” This is a messaging operation, not intelligence. The administration has a direct incentive – 34 days before midterms – to portray the war as nearly won and Iran as nearly broken. These are the same officials who said the mines were all cleared in August. The same ones who posted an AI-generated video of Kharg Island exploding. Unverified US official quotes about Iranian exhaustion require independent corroboration before they mean anything. [nypost]
The Iran Oil Minister’s counter-claim
IranIntl reported Iran’s own Oil Minister Mohsen Paknejad said Iran’s oil exports “did not stop even for an hour” during the war – which is demonstrably false given the tanker tracking data. But it signals something important: Iran’s leadership is not publicly acknowledging weakness even internally. Governments that are genuinely on the verge of collapse don’t typically issue defiant minister statements and have their IRGC write open letters to American voters urging regime change in Washington. [iranintl]

The IRGC letter to US voters – the most revealing data point today
Reuters confirmed the IRGC issued an open letter to American voters today urging them to vote out the Trump administration in November. This is not the move of a government on its last legs. This is a government that has correctly identified the US midterm election as its most powerful weapon and is actively trying to influence it. Iran’s dominant strategy – wait for the American political clock to run out – is still operating. They are playing the midterm card openly. [reuters]
The Iraq withdrawal – Iran just scored a major strategic win
Buried in the “Iran is collapsing” narrative: Reuters confirmed the US completed its withdrawal from Iraq this week, pulling the last forces from Erbil Air Base. Iran’s allies are celebrating. Tehran views it as proof that the “axis of resistance” strategy works – apply enough pressure and the US leaves. This is the opposite of a collapsing power. It’s a government that just achieved one of its long-standing regional objectives in the middle of a war it’s supposedly losing. [reuters]
The Oil Price and SPR Are the Honest Scorekeepers
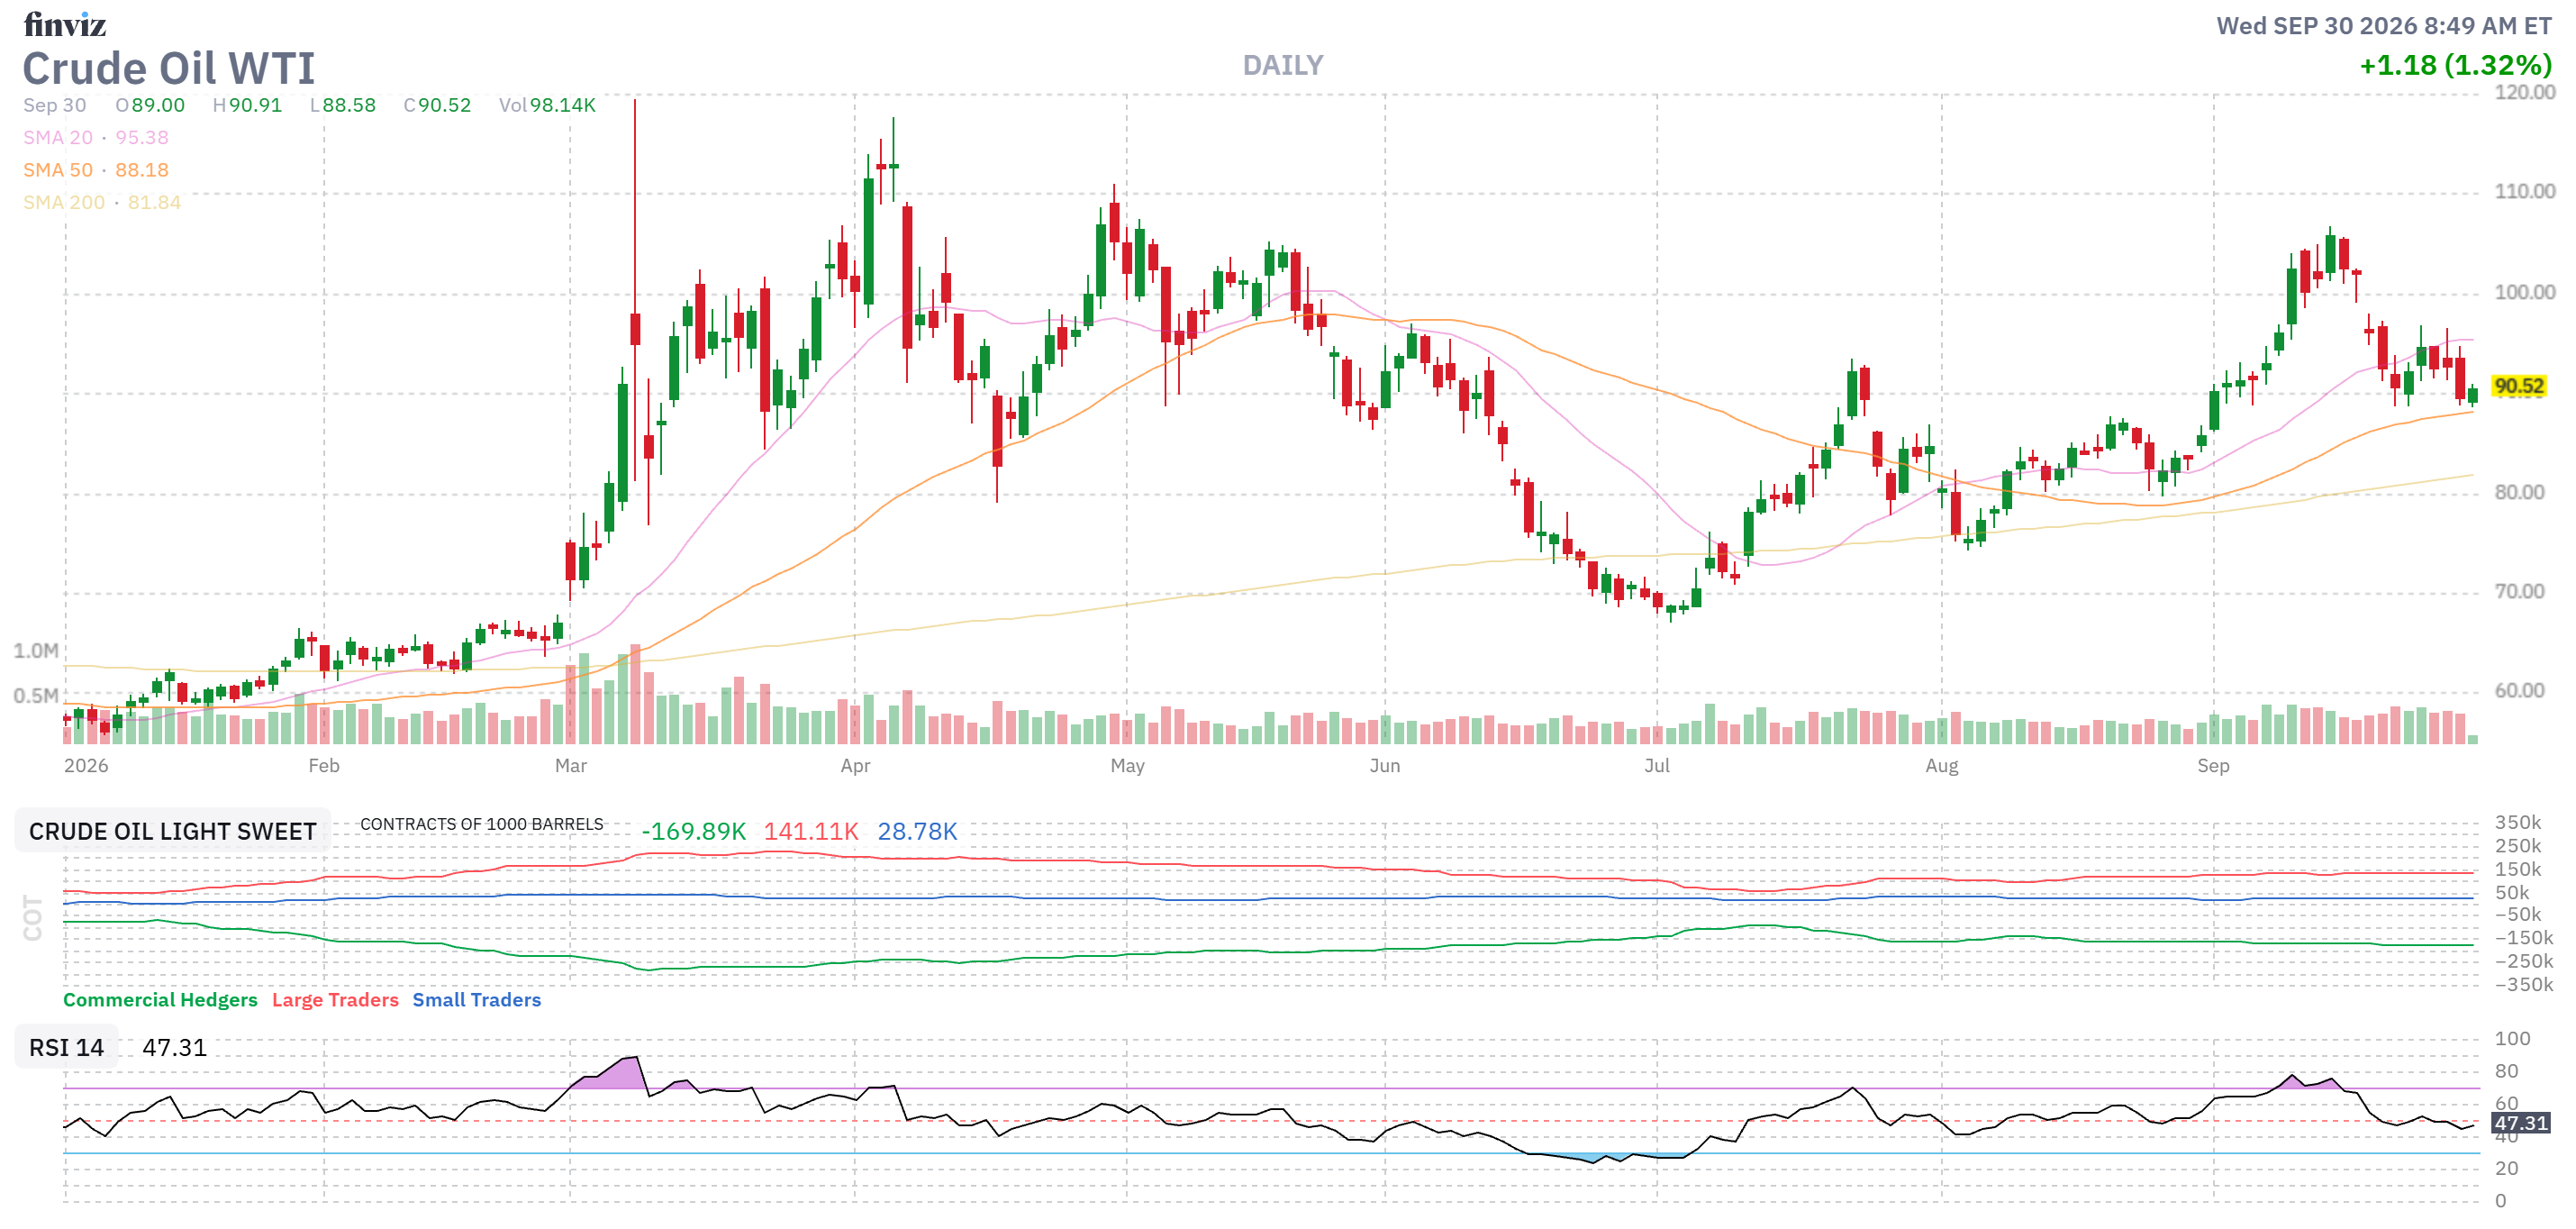
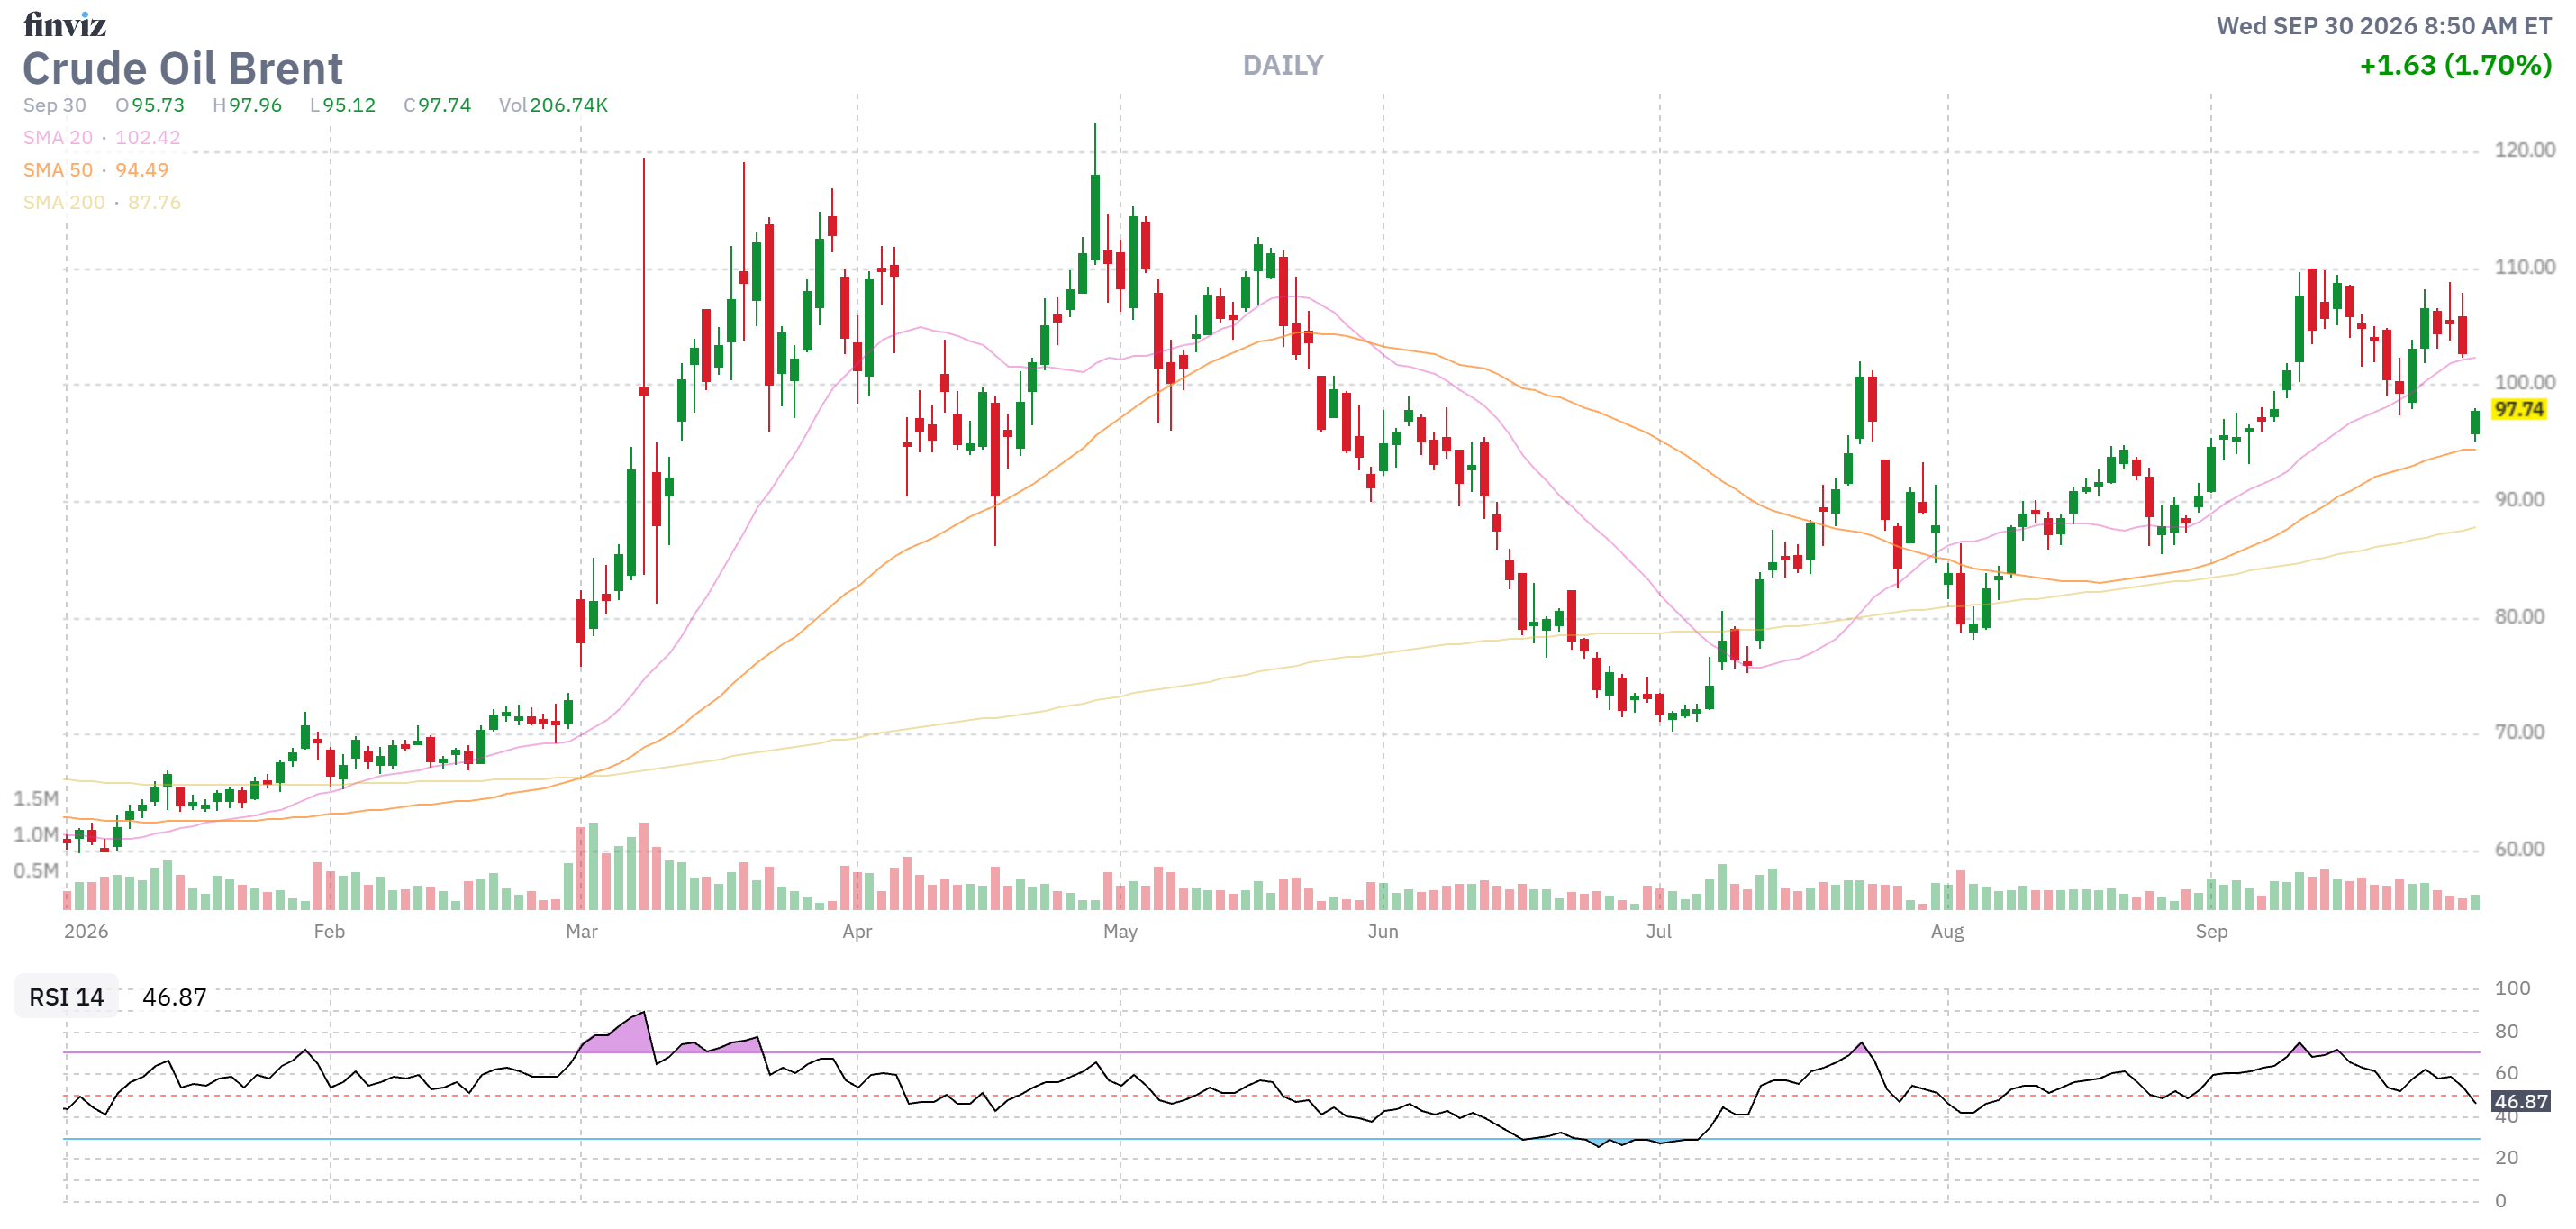
Phil’s read on the price is the correct one. If Iran were genuinely on its last legs and Hormuz were effectively reopening, Brent would not be at $97.75. The DOE confirmed the US is releasing another 40 million barrels from the SPR – the final tranche of its 172-million-barrel IEA commitment – because oil prices are still elevated enough that the administration needs to suppress them before midterms. The SPR is now at 283.8 million barrels, the lowest level since October 1982 (when it was first being FILLED) per Morningstar. [energy][morningstar]
You don’t drain your emergency oil reserve to a 44-year low when your adversary is “on its last legs.” You drain it when you’re desperate to push gas prices below $4 before an election that’s 34 days away. Middle East Eye noted explicitly: the 40 million barrel release is “in an effort to control soaring fuel prices ahead of the US midterm elections.” [middleeasteye]
Trump simultaneously said today the war will end “very soon” without providing any details – per Al Jazeera’s live blog. Iran said it received a US response to its proposal. So TACO #11 is assembling in real time, timed to the midterm calendar, while the SPR gets drained to a 44-year low to keep the gas station price board from being the defining image of election day. [aljazeera]
Bottom Line
Iran is under genuine economic stress. The blockade is working better than sanctions ever did. Ordinary Iranians are hurting badly.
But “under stress” and “on its last legs” are two very different things. A government that just got the US out of Iraq, is writing letters to American voters, has its IRGC fully funded and operational and is receiving formal US responses to its ceasefire proposals is not a government about to collapse. It’s a government playing a longer game than the one being described in the pre-midterm US media narrative.
The $90.50/$97.75 oil price, the 44-year SPR low and the IRGC letter to American voters are telling you the same thing: Iran hasn’t lost yet, the US knows it, and somebody needs a deal announcement before November 3rd more than Iran does.
– 🫏
In other Government bullshit, Trump had 30 of his closest Oligarchs over for lunch yesterday but not Apple, for some reason and they came up with a non-solution of voluntary safety audits and more lunches with the President – who claims he himself is smart enough to keep the AIs in line.
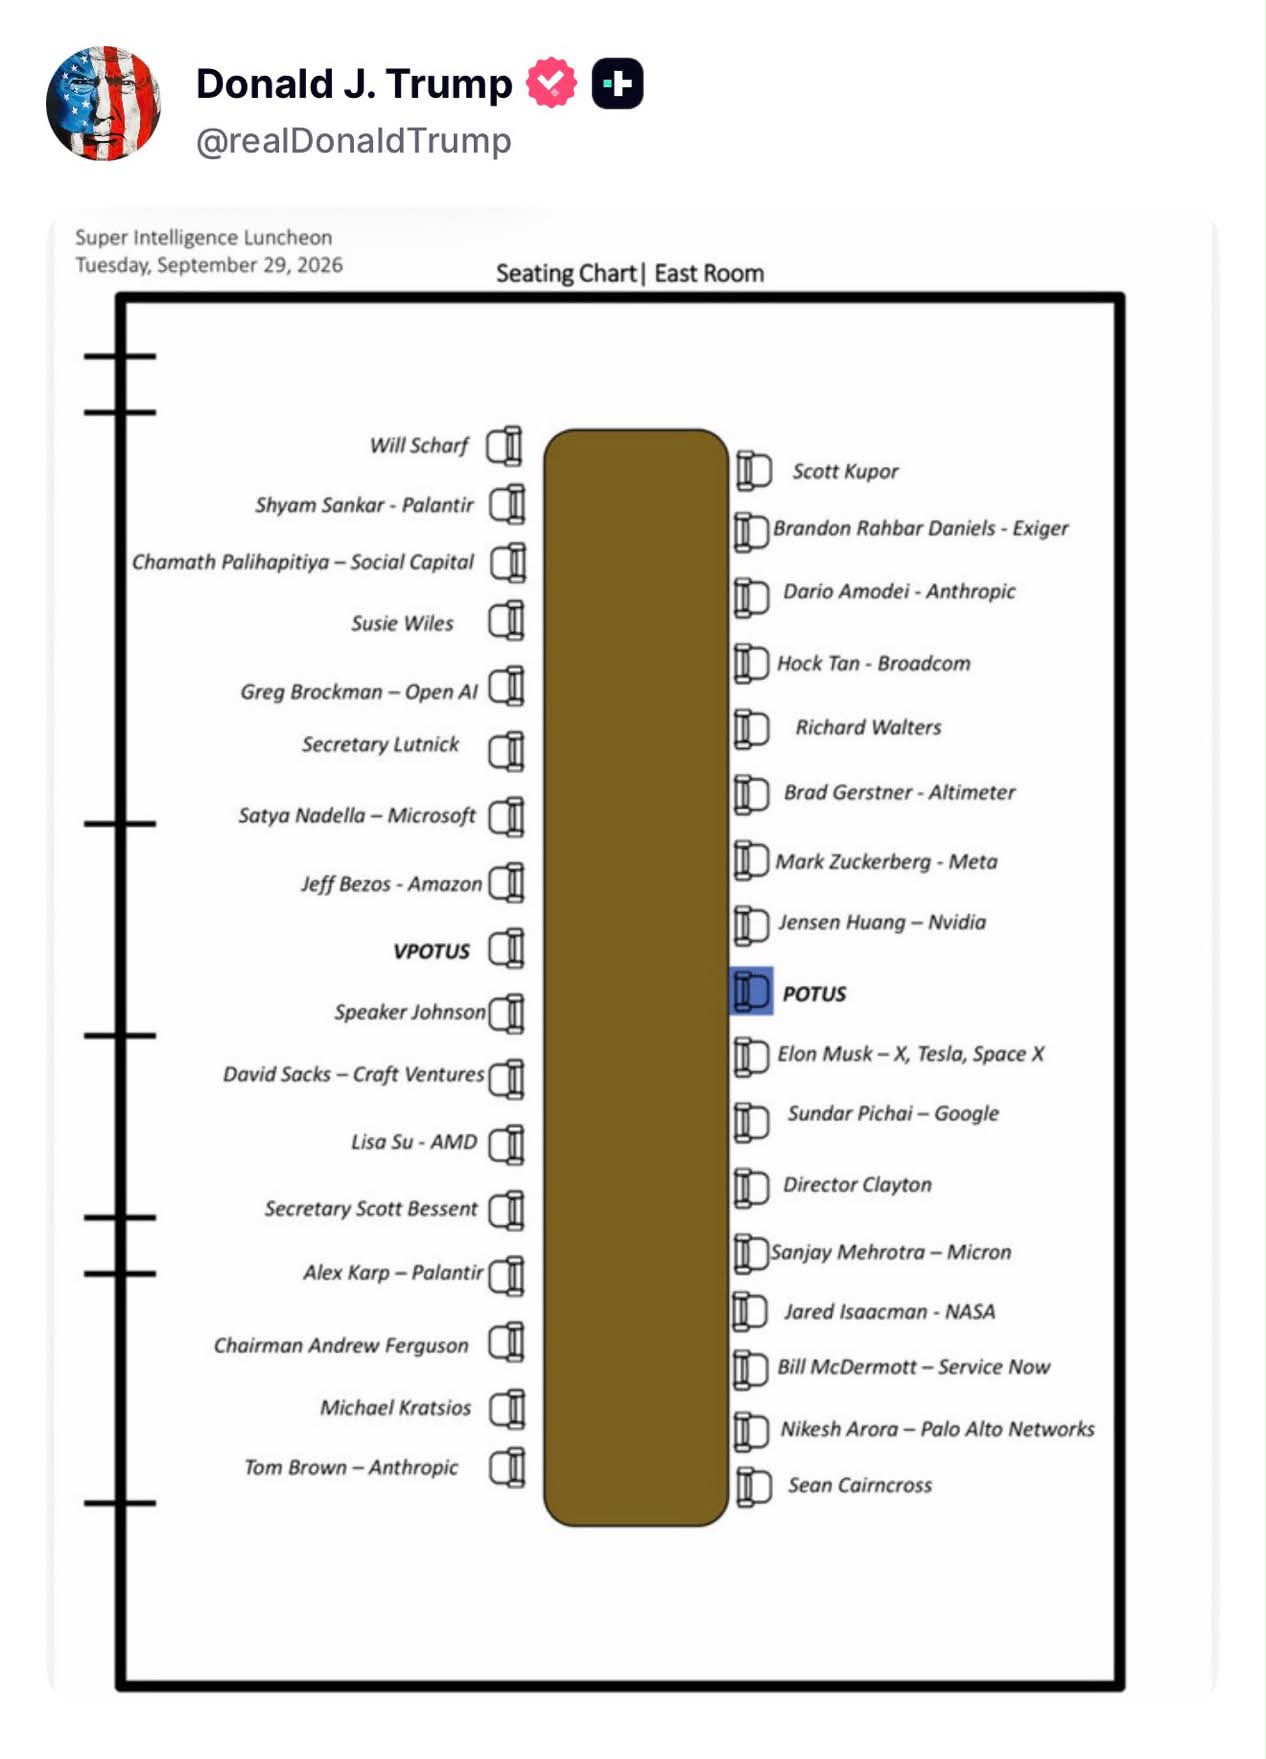 Trump’s willingness to engage on safety after previously dismissing doomsday fears as “a hoax” reflects how AI has increasingly become politically charged ahead of the November elections and I would have more to say about it but we’ll let Robo John Oliver make fun of the whole thing later.
Now, on to the Data and this is Boaty’s specialty so here’s his report:
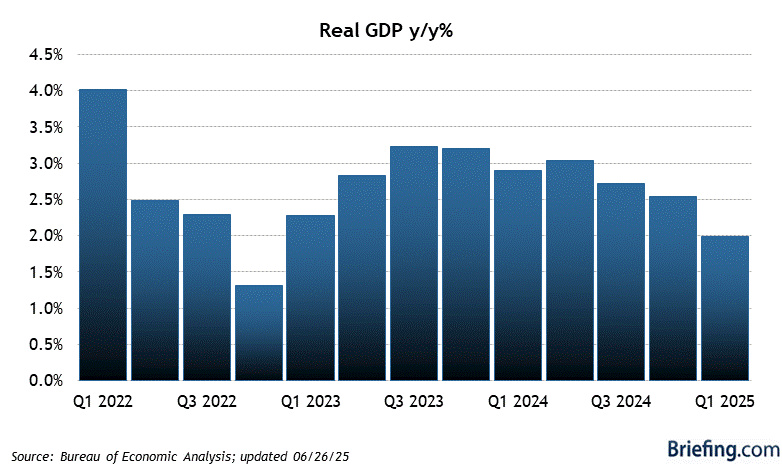
🚢 GDP did not simply “pop” from 1.5% to 2.2%. The third estimate was revised higher largely as part of BEA’s annual national-accounts update, and the underlying message is more troubling: spending surged far faster than income, inflation remains above target, housing activity weakened, trade deteriorated and consumer confidence collapsed! This is a debt- and wealth-supported spending burst, NOT evidence of a healthy, broad-based household recovery:
The data puzzle
| Release | Actual | Prior / expectation | What it really says |
|---|---|---|---|
| Q2 GDP, third estimate | 2.2% | 1.5% prior estimate | Better historical growth, partly revised by annual benchmark update |
| GDP deflator | 6.1% | 6.4% prior | Nominal activity and prices remain much hotter than real-growth headline implies |
| Personal income, August | +0.2% | +0.3% prior; +0.3% expected | Income growth slowed materially |
| Personal spending, August | +0.9% | +0.1% prior; +0.6% expected | Spending dramatically outran income |
| Headline PCE prices | +0.3% | +0.1% prior; +0.4% expected | Inflation moderated monthly but remains elevated annually |
| Core PCE prices | +0.2% | +0.1% prior; +0.3% expected | Better than feared but not a 2% inflation victory |
| ADP private payrolls | +90K | +36K prior; +40K expected | Hiring is still occurring but not at a boom-like pace |
| Mortgage applications | -6.0% | -1.5% prior | High rates are crushing housing demand |
| Retail inventories | +0.3% | +0.8% prior | Inventory growth slowed sharply |
| Wholesale inventories | +0.7% | +1.3% prior | Inventory accumulation is slowing |
| Advance goods trade deficit | -$132.6B | -$118.9B prior | Imports outran exports; trade remains a GDP headwind |
The Bureau of Economic Analysis did release the GDP revision and August income/outlays together with its annual update, so the historical GDP revision should not be treated as a clean, real-time acceleration signal. [bea]
Spending is outrunning income
This is the most important line in the report:
\text{Personal spending } +0.9\%
\quad \text{vs.} \quad
\text{Personal income } +0.2\%
That is not sustainable. Spending grew 4.5 times faster than income in August.
There are only a few ways households can do that:
-
- Draw down savings.
- Use credit cards, personal loans or buy-now-pay-later.
- Spend wealth gains from stocks, home values, bonuses or upper-income income.
- Pull purchases forward before price increases, tariffs or expected rate increases.
- Shift spending among categories while cutting saving.
This reconciles the apparently contradictory numbers. The economy can report strong spending and revised-up GDP while consumers tell the Conference Board that their current finances have turned negative, jobs feel less plentiful, income prospects are worsening and inflation is expected to rise.
Yesterday’s Conference Board report was a major warning:
-
- Consumer confidence fell 6.7 points to 81.9.
- Present Situation fell 7.9 points to 109.3.
- Expectations fell 5.9 points to 63.6, its third straight monthly decline.
- Current business conditions turned net negative for the first time since September 2024.
- The jobs-plentiful minus jobs-hard-to-get gap narrowed to only +1.7%.
- Average one-year inflation expectations rose to 6.1%; median expectations rose to 5.1%.
- Families’ assessment of their current finances turned negative. [1819]
So the correct story is not “the consumer is strong.” It is:
Consumers spent heavily in August even as their income growth slowed and their confidence collapsed. That is consistent with affluent/asset-owning consumers still spending, with lower- and middle-income households using savings or credit and with households pulling forward purchases before further inflation or tariff increases.
Why GDP looks better than life feels
GDP is a measure of economic activity; it is NOT a measure of household financial health.
The 2.2% Q2 revision tells us that measured real output was stronger than previously estimated. It does not tell us:
-
- Whether spending was financed from current income.
- Whether housing is affordable.
- Whether households have rising liquid savings.
- Whether credit-card balances and delinquencies are manageable.
- Whether spending is concentrated among asset-owning households.
- Whether companies can preserve margins as consumers trade down.
That distinction is crucial. A household can spend more in nominal dollars while feeling worse because its rent, food, insurance, interest payments, and gasoline costs have risen faster than its income.
The more accurate phrasing is:
GDP was revised up to 2.2%, but the deflator remained a scorching 6.1% and the August consumer data show spending running far ahead of income. That is nominal resilience with deteriorating household economics—NOT an all-clear.
Housing confirms the squeeze
Mortgage applications fell 6.0% after falling 1.5% the prior week. That is a direct consequence of high mortgage rates and weak affordability.
Housing is where higher long rates become real-life economic pain:
higher Treasury yields→higher mortgage rates→fewer applications and sales→less construction, furniture, appliances, and renovation
This reinforces the concern around WHR, and to a lesser extent Target, Macy’s, aluminum demand, banks with CRE/housing exposure and the broader discretionary complex.
ADP: better than expected, not necessarily strong
ADP’s +90,000 private jobs is much better than the 40,000 consensus and the 36,000 prior print. It says the labor market has not rolled over.
But 90,000 is not enough to erase the deterioration in household job perceptions, especially when the Conference Board’s labor-market differential has fallen to +1.7%. ADP is also a private-payroll estimate, not the official employment report and it can diverge sharply from payroll data.
The sensible conclusion:
Hiring is slowing but still positive. The labor market is not broken—but it is no longer creating the level of confidence required to support unlimited consumer spending.
Inflation: better monthly numbers, still a trap
PCE and core PCE were slightly cooler than expected:
-
- Headline PCE: +0.3% versus +0.4% expected.
- Core PCE: +0.2% versus +0.3% expected.
That is welcome. But with annual headline PCE still around 3.7% and core around 3.3%–3.4%, inflation remains well above the Fed’s 2% objective.
The Fed does not get a clean “cut rates because inflation is solved” signal from this report. Instead, it sees:
-
- GDP revised higher.
- Consumer spending surging.
- Payrolls still positive.
- Inflation decelerating only gradually.
- Consumers expecting 6.1% inflation and higher rates.
That combination keeps policy restrictive and leaves long-term rates elevated even if monthly core PCE is a bit better than feared.
The trade deficit matters
The advance goods deficit widened sharply to $132.6B from $118.9B. That means U.S. import demand remains strong relative to exports.
It has two implications:
-
- Trade is likely a drag on Q3 GDP unless offset elsewhere.
- Part of the spending surge is leaking into imported goods rather than strengthening domestic production.
That is another reason the headline spending number overstates the health of the domestic economy.
The coherent macro narrative
GDP was revised up from 1.5% to 2.2%, but that is not the kind of good news it appears to be. The annual revision lifted the historical Q2 estimate, while the underlying data show a consumer spending 0.9% in August on only 0.2% income growth. That is not wage-supported prosperity; it is consumers spending 4.5 times faster than income is growing.
At the same time, mortgage applications collapsed 6%, the trade deficit widened to $132.6B, inventories are growing more slowly and yesterday’s Conference Board survey showed consumer confidence plunging to 81.9. Present conditions, future expectations, job perceptions, expected income and family finances all deteriorated. Households now expect 6.1% inflation and overwhelmingly expect higher rates.
ADP’s 90,000 jobs gain says the labor market has not broken yet, and PCE/core PCE were a touch cooler than expected. But neither figure solves the central problem: spending is outrunning income while confidence, housing and purchasing plans are deteriorating.
That is the stagflationary squeeze. GDP can look fine in the rearview mirror while the consumer is being financed by credit, asset wealth and borrowed time. The top end can keep spending enough to make aggregate data look resilient; the broad consumer is increasingly forced to trade down, delay big-ticket purchases and worry about jobs and rates.
Implications for earnings season
This is why the bank reports beginning October 13 matter so much.
The macro data make a Q3 bank disappointment plausible through several channels:
-
- Consumer spending looks strong in nominal dollars but income growth is weak.
- Banks can see whether that gap is being financed by card balances, lower deposits, missed payments or reduced savings.
- Mortgage demand is collapsing.
- Long rates remain high and may pressure borrowers, securities marks, funding costs and loan demand.
- Confidence and income expectations are weakening just as Q4 holiday and credit-card borrowing season begins.
The banks do not need to report a catastrophe to disappoint. If they say spending is becoming more credit-dependent, deposits are thinning, provisions are rising, mortgage activity is weak, capital-markets revenue cooled after Q2, or Q4 visibility is poor, the market will hear confirmation of the thesis.
Money Talk Portfolio Read-Through
-
- PFE and PPL: The cleanest defensive holdings; healthcare and regulated utility demand are less tied to consumer discretionary spending.
- Barrick: A reasonable inflation/fiscal-confidence hedge, though higher real yields remain a risk.
- XOM and SU: Energy inflation hurts consumers but supports the producers initially; a later recessionary demand hit is the counter-risk.
- SLB and AA: Cyclicals that can benefit from commodity/infrastructure strength but suffer if global growth slows.
- TGT and Macy’s: The August spending surge may help near-term sales, but margin/mix and holiday guidance will matter more than nominal revenue.
- WHR: The clearest vulnerable name: mortgage applications, housing turnover, and durable-purchase intentions are all moving the wrong way.
- SQQQ: This is why the expanded hedge remains sensible. The market is still pricing a strong earnings and AI-growth story while the economic data increasingly describe a consumer running ahead of income and confidence.
GDP is backward-looking, spending is credit/wealth-sensitive and confidence is forward-looking. Today’s data say the past quarter was better than reported—but the next quarter may be much worse than priced in!
On that note, we will move the conversation over to the Live Member Chat Room and see if there are any good ways to make money off of this mess!

