What does it mean to analyze the earnings of an index that has no earnings of its own? Look through the index at the weighted fundamentals of its constituent companies, then consider the rules that determine which stocks are included and how much influence each one carries. That’s the heart of fundamental analysis of major indices.
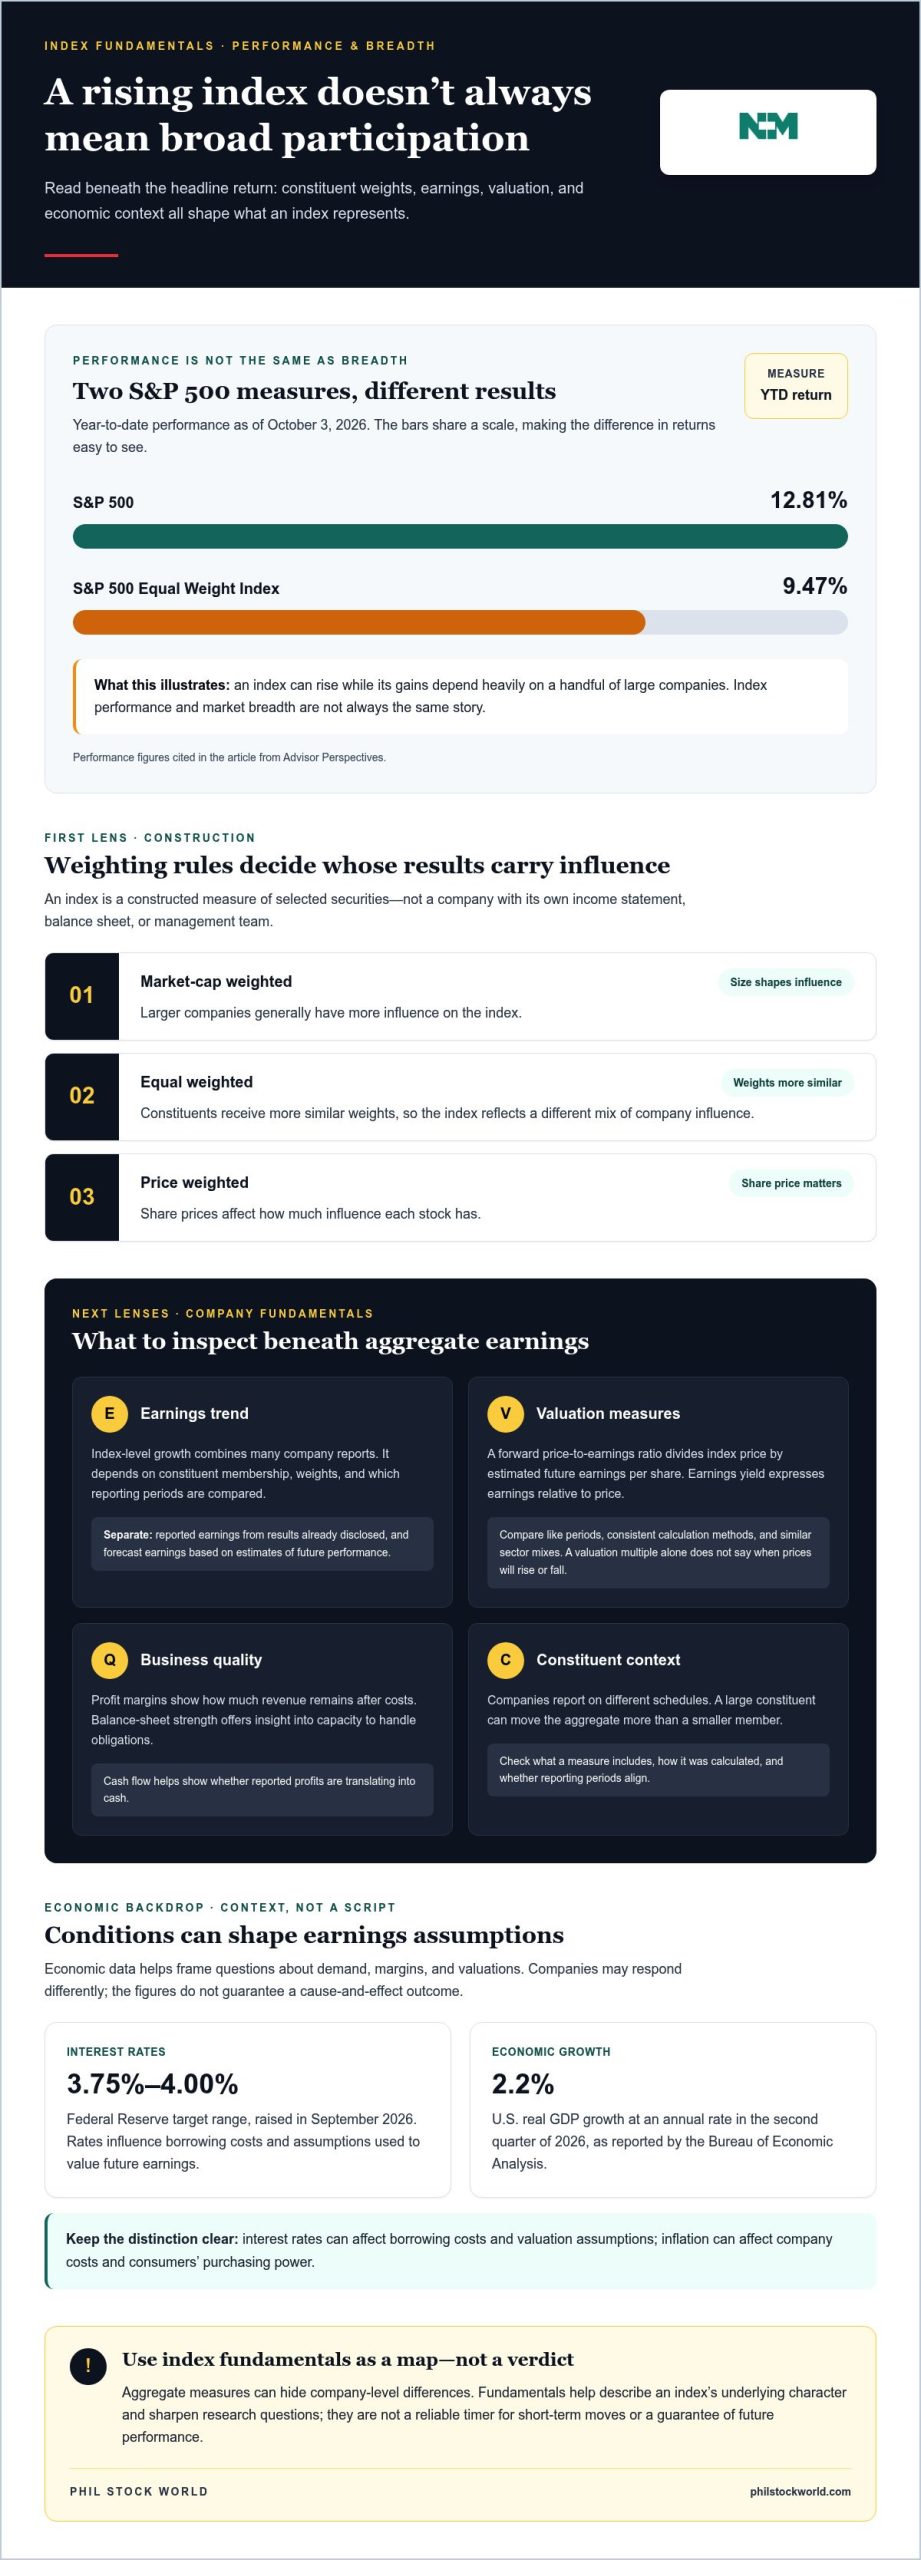
If valuation measures seem to tell conflicting stories, or rate and inflation headlines feel disconnected from market moves, there may not be a single metric that resolves the mismatch. An index can rise while its gains depend heavily on a handful of large companies. For example, as of October 3, 2026, the S&P 500 was up 12.81% year to date, compared with 9.47% for the S&P 500 Equal Weight Index, according to Advisor Perspectives. The gap is a reminder that index performance and market breadth aren’t always the same story.
This guide connects index construction with earnings, valuation, and economic conditions, then compares benchmarks without treating them as interchangeable. You’ll also find a repeatable research framework and a clear view of what index-level analysis can and can’t tell you.
Key Takeaways
- Read an index through its constituents, combined financial measures, and construction rules, not as if it were a single company.
- Use earnings trends and valuation measures together, and account for concentration and differences in reporting periods.
- Compare the S&P 500, Nasdaq-100, Dow, and Russell 2000 by their scope, weighting, and constituent profiles.
- Apply a repeatable process for fundamental analysis of major indices, from defining your question to checking earnings, breadth, valuation, and economic context.
- Treat index fundamentals as context for better market questions, not a forecast: aggregate data can hide company-level differences and cannot guarantee future performance.
What fundamental analysis of major indices can, and cannot, tell you
An index has no standalone income statement, balance sheet, or management team. To analyze its fundamentals, look at the companies it contains, how their financial data is combined, and the rules that shape membership and weighting. A stock market index is a constructed measure of a selected group of securities, not a business with its own operating results.
Index fundamental analysis is the study of an index’s constituent companies, combined financial measures, and construction methodology to understand what may be driving its underlying business profile. Two sources can report different valuation figures for the same benchmark if they use different constituents, earnings periods, or calculation methods. The methodology is part of the analysis, not fine print.
Why an index is not a single company
Constituents don’t always contribute equally to an index. In a market-cap-weighted index, larger companies generally have more influence. In an equal-weighted index, constituents receive more similar weights. In a price-weighted index, share prices affect each stock’s influence. As a result, the same change in a company’s earnings can affect different indices in different ways.
Aggregate measures also depend on calculation choices. A reported price-to-earnings ratio might use trailing or forecast earnings, and calculations can differ in how they handle companies with losses or missing data. Companies may also report on different schedules. Before comparing figures, check what each measure includes and how it was calculated.
What fundamental analysis can and cannot answer
Fundamental analysis of major indices helps frame questions about aggregate earnings growth, valuation, constituent financial strength, and sensitivity to conditions such as interest rates or consumer demand. It can also show when an index-level result is driven by a narrow group rather than broad participation. These clues help describe the market’s underlying character.
Fundamental analysis offers a different lens from chart-based analysis. Fundamentals examine company results, balance sheets, and valuation; technical analysis studies price behavior and trading volume. The approaches can complement each other, but neither removes uncertainty.
Fundamentals aren’t a reliable timer for short-term moves. Prices can react to expectations, news, positioning, and events that aggregate financial data doesn’t capture. Use the framework to understand what an index represents and ask sharper research questions, not to treat analysis as a guarantee or a personalized investment recommendation. An index-level metric is a map of the group, not a verdict on every company inside it.
The fundamentals that shape a major index
An index’s earnings picture is assembled from many company reports, not a single set of books. Index-level earnings growth describes how the combined earnings of its constituents change over time. The result depends on which companies are included, how they’re weighted, and which reporting periods are compared. A large constituent’s results can move the aggregate more than a smaller member’s, while mismatched fiscal quarters can make a snapshot harder to interpret.
Earnings, valuation, and balance-sheet quality
Separate reported earnings, based on results already disclosed, from forecast earnings, which reflect estimates of future performance. A forward price-to-earnings ratio divides the index’s price by estimated future earnings per share. Earnings yield expresses earnings relative to price. Neither measure is self-explanatory: compare like periods, consistent calculation methods, and similar sector mixes. Different industries naturally have different margin and valuation profiles.
Valuation is a reference point, not a market-timing signal. A high multiple may reflect optimistic growth expectations, while a lower one may reflect weaker prospects or greater perceived risk. By itself, a valuation multiple doesn’t tell you when prices will rise or fall.
Look beyond the headline ratio. Profit margins show how much revenue remains after costs. Balance-sheet strength offers insight into a company’s capacity to handle obligations, while cash flow helps show whether reported profits are translating into cash. Across an index, these measures can indicate whether aggregate earnings rest on resilient businesses or may be vulnerable to financing pressure, falling demand, or rising costs.
Economic conditions and index earnings
Economic data provides context, not a guaranteed cause-and-effect script. Interest rates influence borrowing costs and the assumptions investors use to value future earnings. The Federal Reserve raised its target range to 3.75%-4.00% in September 2026. Inflation can affect company costs and consumers’ purchasing power. The Bureau of Economic Analysis reported that U.S. real GDP grew at a 2.2% annual rate in the second quarter of 2026. These figures help frame questions about demand, margins, and valuations, but companies may respond differently. FINRA’s overview of key economic indicators offers useful context for interpreting broader data.
For company-level detail, read SEC filings alongside index aggregates. Earnings releases and annual or quarterly reports can clarify revenue drivers, debt, cash generation, and management’s discussion of risks. Check the filing date and reporting period before connecting a company’s results to a current index reading. Pair that research with ongoing market commentary and analysis to put the numbers in broader market context.
How the S&P 500, Nasdaq-100, Dow, and Russell 2000 differ
“The market is up” can describe very different groups of companies, depending on which index you mean. The S&P 500, Nasdaq-100, Dow Jones Industrial Average, and Russell 2000 each use distinct membership and weighting rules. Those design choices shape their earnings profiles, sector exposure, and valuation measures. None is a complete stand-in for the entire U.S. economy.
What each index represents
| Index | Scope and weighting | Typical constituent profile | Analysis caveat |
|---|---|---|---|
| S&P 500 | About 500 leading U.S. large-cap companies; float-adjusted market-cap weighted. | Large, established businesses across multiple sectors. | Larger companies have more influence, so aggregate results can reflect a handful of major constituents. |
| Nasdaq-100 | 100 of the largest nonfinancial companies listed on Nasdaq; modified market-cap weighted. | Often has substantial exposure to technology and growth-oriented businesses. | Its listing and eligibility rules, plus sector concentration, make it different from a broad-market measure. |
| Dow Jones Industrial Average | 30 selected U.S. companies; price weighted. | Established, prominent companies from a range of industries. | A higher share price can give a stock greater index influence, regardless of the company’s total market value. |
| Russell 2000 | Small-cap segment drawn from the Russell 3000; market-cap weighted. | Smaller U.S. companies, with a different balance of business maturity and financing needs than mega-caps. | Smaller firms may be more sensitive to borrowing costs, domestic demand, and changes in profitability. |
These distinctions matter in practice. The S&P 500 offers a broad large-cap view, but it isn’t an equal-weighted snapshot of every company. The Nasdaq-100’s modified weighting still leaves it shaped by its largest constituents. In the Dow, a stock’s share price affects its influence, rather than its total market value. The Russell 2000 provides small-cap exposure, where earnings and balance-sheet trends may differ from those of established large companies.
Why one valuation number can mislead
Sector mix can tilt an index-wide valuation. Information Technology represented 38.79% of the S&P 500 on October 1, 2026, according to US500.com. A valuation measure for that index therefore reflects its composition as well as company fundamentals. Small-cap and large-cap businesses can also face different earnings pressures, so a valuation gap doesn’t automatically mean one group is a bargain.
For example, GuruFocus reported an S&P 500 P/E ratio of 26.219 on October 2, 2026, while Worldperatio reported an estimated Russell 2000 P/E of 16.45 that day. Treat those figures as a starting point, not an apples-to-apples verdict: data providers may use different earnings periods and calculation methods. In the fundamental analysis of major indices, compare index rules, sector exposure, and valuation methodology before drawing conclusions.
A repeatable process for analyzing index fundamentals
A disciplined review doesn’t need to predict the next move. It should answer a clear question using comparable evidence. Use this workflow to make fundamental analysis of major indices consistent and easy to revisit:
1. Define the question. Are you examining earnings momentum, valuation, economic sensitivity, or why one benchmark is behaving differently from another? A focused question keeps your research from becoming a pile of unrelated numbers.
2. Identify the index and check its methodology. Confirm which companies are eligible, how the index is weighted, and whether reconstitution or sector rules are relevant. Then assess whether a small number of constituents dominate the index, since their results may have an outsized effect on aggregate measures.
3. Check breadth and earnings direction. Look beyond the index total. Assess how widely earnings trends are shared across constituents and whether the measure uses reported results or forecasts. Record the reporting periods so you don’t compare companies on mismatched timelines.
4. Review valuation and economic context. Choose a measure suited to your question, such as trailing or forward P/E, and use a consistent definition across comparisons. Then consider relevant conditions, including rates, inflation, and economic growth, as context for business costs, demand, and valuation assumptions. Don’t treat them as a mechanical explanation for every market move.
5. Record the risks and unknowns. Note data gaps, changes in index composition, forecast uncertainty, and differences in methodology. Finish by stating what the evidence supports and what remains unclear. This is analysis, not a forecast.
Build a dated snapshot
Put an “as of” date on every review, and label figures as trailing, forward-looking, or calendar-year based. Before interpreting an aggregate metric, revisit the index rules and constituent concentration. A concise note might read: “The index’s forward P/E was [value] as of [date], based on [forecast period]; constituent concentration and estimate revisions may affect the reading.” Naming the measure, date, and caveat makes the comparison easier to check later.
Pair fundamentals with market evidence
Fundamentals help explain the businesses and valuation behind an index; they don’t pinpoint an entry or exit. For the price-and-volume side of the picture, see how to read market charts. To consider how broader market context relates to a portfolio, explore a virtual portfolio review. For ongoing context as you apply the framework, explore market analysis and commentary.
Turn index fundamentals into better market questions
Fundamental analysis is most useful when it sharpens the questions you ask about a market, rather than offering a neat prediction. It can help explain what an index represents, whether earnings trends are broad or concentrated, and how valuation compares with the underlying business picture. Index aggregates smooth over important differences between companies, and no set of fundamentals can guarantee future performance.
Questions to ask before drawing a market conclusion
Before deciding what an index’s numbers suggest, pause and test the story:
- How broad is the move? Are earnings and performance improving across many constituents, or does a small group account for much of the index-level result?
- Are the comparisons fair? Do the valuation and earnings measures share the same date, reporting period, forecast assumptions, and calculation method?
- What could challenge this view? Consider weaker earnings guidance, changing economic data, or a shift in index composition that might undermine the initial interpretation.
These checks keep a compelling headline or valuation figure from carrying too much weight. An index can look strong while parts of its membership struggle; a low multiple can reflect real business pressures rather than an overlooked opportunity. The details matter.
Keep the analysis useful, not overconfident
Make the distinction between facts, estimates, and interpretations explicit. A company’s reported earnings are a fact for a stated period; analysts’ future earnings projections are estimates; your view of what either means for the index is an interpretation. Keeping those categories separate makes a market summary easier to revisit and less likely to turn an assumption into apparent certainty.
Update your view as new company reports and economic releases arrive. Ask whether the evidence still supports your original read, or whether the balance of earnings, valuation, and market participation has changed. That’s the practical value of fundamental analysis of major indices: a repeatable way to understand context, not a short-term timing device or a personal investment recommendation.
Phil Stock World’s market commentary, charts, and educational analysis can provide ongoing context as you follow those developments. Use them to keep asking sharper questions, not to outsource your judgment.
Make index analysis part of your market routine
Major indices aren’t interchangeable scorecards. Their construction and weighting shape what their earnings and valuation figures reveal, so compare benchmarks using consistent measures and dates. The fundamental analysis of major indices can help you understand index composition, earnings trends, and economic context, but aggregate metrics hide differences between companies and can’t predict future performance.
A steady process beats a confident guess: separate reported facts from estimates, check what’s driving the index, and revisit your view as new information arrives. Use market context to ask better questions, not to assume you have a guaranteed answer.
Phil Stock World, founded and led by veteran trader and market analyst Phil Davis, offers market commentary, analysis, charts, educational resources, and virtual portfolio reviews. Its membership tiers provide access to research, trade alerts, community discussion, and interactive trading sessions. Explore Phil Stock World’s market analysis and commentary and consider a Premium Membership for ongoing market context as you build your own research framework.
Frequently Asked Questions
What is fundamental analysis of major indices?
Fundamental analysis of major indices studies the companies inside an index, how they’re weighted, and what their combined earnings, valuations, and financial conditions suggest. An index doesn’t have its own operating results, so its aggregate figures come from constituent data and calculation methods. Interpret each reading alongside the index methodology, sector mix, and data date. Those details help explain what a headline metric captures and what it leaves out.
Can you use fundamental analysis on a stock market index?
Yes. Analyze an index through its constituent companies and published aggregate measures, including earnings growth, valuation, financial strength, sector composition, and concentration. First check how the index is constructed, since weighting rules determine which companies have the greatest effect on its overall figures. Index fundamentals can help describe the market’s underlying business profile, but they aren’t a dependable forecast of short-term returns or a substitute for understanding the index’s limitations.
Which fundamentals matter most when analyzing the S&P 500?
Start with constituent earnings and earnings growth, then examine valuation, sector mix, and the influence of the largest companies. Profit margins and balance-sheet strength can add context about business resilience. No single measure tells the whole story. Check whether earnings figures are reported or forecast, use consistent reporting periods when comparing data, and record the date and methodology behind each index-level metric. This helps keep comparisons grounded and meaningful.
How is fundamental analysis of the Nasdaq-100 different from the S&P 500?
The Nasdaq-100 and S&P 500 have different constituent universes, sector exposures, and weighting rules, so their aggregate earnings and valuation measures may tell different stories. The Nasdaq-100 isn’t simply another label for the broad U.S. market. Compare each index’s current methodology and composition before interpreting a valuation gap. A difference alone doesn’t establish that one index is cheap, expensive, or destined to outperform the other.
What does a high index P/E ratio mean?
A high price-to-earnings ratio means investors are paying more for each unit of the earnings measure used in the calculation. It may reflect growth expectations, sector composition, interest-rate assumptions, or temporarily low earnings. The figure alone doesn’t prove an index is overpriced. Check whether the P/E is trailing or forward-looking, note its date, and compare it with relevant historical context using a consistent calculation method.
Do interest rates affect major stock indices?
Interest rates can influence company financing costs, consumer demand, and the assumptions investors use to value future earnings. The effect varies across companies and sectors, so an index-wide response isn’t automatic or uniform. Consider rate changes alongside earnings, inflation, and broader economic conditions. A policy announcement can shape market expectations, but it doesn’t determine an index’s direction on its own.
How often should investors review index fundamentals?
Review index fundamentals when earnings reports or important economic data may have changed the picture, and keep the dates of your figures visible. The right cadence depends on your time horizon and research needs. Checking constantly can add noise without improving understanding. Focus on whether the index’s composition, earnings direction, or valuation assumptions have materially shifted, rather than reacting to every headline or short-term price move.
Are index fundamentals enough to decide when to buy or sell?
No. Fundamentals can help explain an index’s composition, business conditions, and valuation, but they don’t reliably identify precise market turning points. Treat the analysis as context, not a trading signal or personalized investment recommendation, and consider its uncertainties alongside your own objectives and time horizon. Avoid relying on a single metric, and remember that historical market behavior can’t guarantee future results.