
 I am still trying to get more bullish.
I was thinking about writing something cute like I resolve to get more bullish but that would be wrong. I try, in my own humble way, to "get" the market right. That means I am not bullish or bearish but Truthish (to further botch Stephen Colbert's use of the word) and, as Buddah says: "There are only two mistakes one can make along the road to truth; not going all the way, and not starting." Confucious reminds us that there are three methods by which we may learn wisdom: "First, by reflection, which is noblest; Second, by imitation, which is easiest; and third by experience, which is the bitterest."
In that spirit, we will spend the day in reflection so that we are better able to start on that long road to the truth so that we will be better able to imitate the things that will work in the year to come while trying to avoid making mistakes that will give us bitter experiences.
This post is not about me – We had a fantastic year and I've already given some outlook for 2011 back on the 19th in that weekend's "It's Never too Early to Predict the Future" and our current position is short-term bearish in the Jan-April time-frame, looking for a pullback to at least 1,200 on the S&P and possibly back to 1,150.
After that, we are expecting a return to steady gains but without the irrational exuberance we're currently experiencing. So no, I am not bearish – I simply think we've gotten ahead of ourselves. Since we don't know where the rally train will stop, we have our "Breakout Defense – 5,000% in 5 Trades or Less" from Dec 11th, which were a set of very bullish, highly levered plays where a little bet can pay off a lot if we simply hold our long-established breakout levels.
 How much is "a lot"? Well my GE trade idea, for example, was to sell the 2013 $12.50 puts for $1.10 (net $1.15 in ordinary margin according to TOS) and to use that money to buy the 2012 $17.50/20 bull call spread for .95, which was a net .15 credit on a $2.50 spread that was on the money at the time. GE has gained about .75 since the 11th and the short puts have dropped to $1 while the bull call spread has gone up to $1.10 so already net .10 is realized on that trade, up .25 in 3 weeks on a trade that PAID YOU .15 to take it! This is the way to hedge the upside when we're unsure of the market – pick stocks that, even if they drop, we will be happy to buy them for the long-term at a discount and then lever that credit into upside plays that give us additional, significant returns. In addition to the 5 original plays, I added 2 more in the comments under that post and PFE took off like GE but CAKE is still a great entry opportunity so it's worth going back to the post to take a look.
These are not fast gainers because we are NOT bullish. These are hedges that will slowly but surely grind out huge returns if we are WRONG and the market keeps going up and the beauty of them is that they are just as slow to lose us money if our short-term premise is correct and the market goes down. What's the worst thing they can do to us on this trade? Sell us GE for net $12.15, 33% off the current price – oh boo hoo, please Brother Fox – PLEASE don't throw us into that there briar patch! I find it amusing when people point out the "flaw" in this strategy – that if the market crashes, we may be "forced" to buy GE for $12.50.
 As I mentioned that weekend, the following is a list of stocks that you may force us to buy at 33% off: BA, GE, VLO, XOM, MO, WFR, UNG, PFE, MCD, KO, JPM, FDX, HPQ, GS, GOOG, AAPL, DIS, T, VZ and AA. Anyone who has some now that they would like to unload for 2/3 of the current price – just give us a call and we'll be happy to accommodate you. If not though, then we can always find someone who is willing to buy put contracts from us, which obligate us to buy those stocks for 33% off in 2013 in exchange for cash today. I call this approach the Wimpy strategy, in honor of J. Wellington Wimpy, who very famously offered to eat now and pay later – technically inventing the first credit card in the 1930s.
Notice that we are willing to buy mainly blue-chip stocks and, of course, our favorites change from time to time and we get the occasional great opportunities like BP and RIG this year as well as IMAX, MON and VLO – those are all ones we're done with at this point. Timing is important too as we get a lot more cash when the market is down and the VIX is high but there's always individual stock stories we can jump on because we are VALUE, LONG-TERM investors at heart – our goal is to build solid virtual portfolios that will still pay us an income on Tuesdays along the way. Let's keep that in mind as we contemplate the year that was and the year that is yet to come:
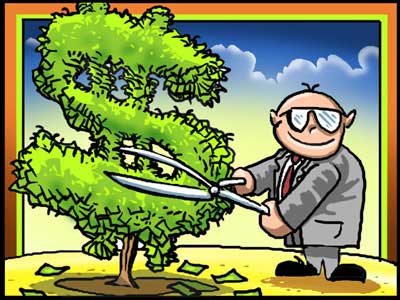
Looking backwards, there's one overriding FACT that we can hang our hats on – Since the March lows (S&P 1,050ish), the market cap of US stocks has gained $6Tn. At a p/e of 20, we would expect to see at least $300Bn of additional earnings to justify that and I don't think I have to run the math to show you that didn't happen.
As for where the hell did $6,000 Billion come from – TrimTabs points out that Corporate America has been SELLING stock, raising the overall float by $133Bn since April (new issues, conversion). Retail funds and ETFs have had just net $17Bn of inflows while foreign investors have put in $109Bn while Pension Funds have moved less than $100Bn from bonds and cash to equities since the rally began. That leaves only Hedge Funds, who showed a net outflow of $12Bn from April to November so are not a likely source, retail investors, who have lost 30% of their net worth since 2008 – even after the bounce and then there's the Fed and their pet IBanks (or is it the IBanks and their pet Fed?).

Of course you don't need $6Tn to move the markets up $6Tn – as a rule of thumb, net 10% is generally enough to push the markets around, the rest is taken on faith that, if one out of ten people is willing to buy a stock for some silly price today, then of course you can find 9 other suckers to pay that price down the road. This model makes sense in a "regular" market but what if that 10% injection of $600Bn (exactly what Bernanke promised for QE2) requires those other $5,400Bn worth of suckers investors – isn't that a lot of money? I don't know, maybe I'm out of touch with the "new normal" but back in my day, $5.4Tn was the entire GDP of China or Japan and almost double that of Germany – it just seems like a lot of free money that's expected to be floated around and that, of course, assumes the US is the only market that went up and demands to be fed fresh cash.
 That leaves us with a $36Tn US Market Cap and many of our top prognosticators are looking for another 20% run in the markets in 2011. One of the annoying things about consecutive runs like this is that you now need $20% of $36Tn to move the markets up, as opposed to 20% of $30Tn which means, ignoring valuations concerns, that the market needs another $7.2Tn in 2011 to get us to S&P 1,450. Even if we run the next $7,200Bn on the same exuberance that allowed us to jump the first $6,000Bn, we still need inflows of ANOTHER $720Bn in net cash.
I'm a little hard pressed to find that at the moment but that's why we're hearing all this noise about QE3 and QE4 and EU stimulus and Japan stimulus and China stimulus – because there is no other logical, rational way for another $720Bn to come into the market in 2011, even if we assume values will be able to rise $13,200Bn on $1,320Bn over a two year period.
The great problem with rapid market rises that inflate the price of the markets 10 times faster than the cash comes in is you can't count on only 1/10th of the people to turn around and trying to sell over the same length of time as the buying took place nor can you be certain that there will be $600Bn worth of buyers to relieve the pressure in a declining market. Of course, nothing like that has ever happened in th stock markets since 2008 – as long as we don't count March of 2009 or last January or last April or that silly "flash crash" thing that will never happen again because they looked REALLY hard and it turns out it was nobody's fault. Yep – I'm about as confident as I can be for 2011!
 Stock World Weekly has some nice forward-looking views on 2011 that make for nice reading today. The Dow finished the year up 11.02%, up 1,149.46 since Jan first and has, in fact, been up 4 of the last 5 years. Unfortunately, that one year was a doozy although, overall, we're up 5% (600 points) since Jan 3rd 2006, when the Dow opened at 10,959 and all of those gains thanks, of course, to our mighty post Thanksgiving run. As SWW points out::
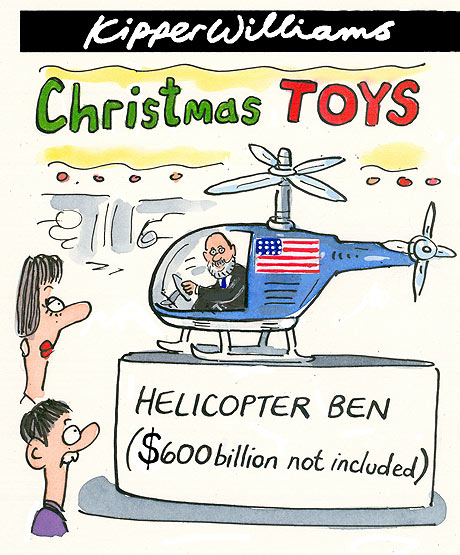
One important thing to keep in mind while looking at these charts is that in August the Fed decided to renew quantitative easing and began by buying $30Bn in 2-10 year Treasury notes per month. In September Bernanke expressed concerns about high unemployment rates in the U.S., and began dropping hints of a greatly expanded program of quantitative easing which would become known as “QE2”. On November 3rd, the Fed then officially announced the launching of the $600Bn+ program of Treasury purchases.
So we can pretty much chart the run from Aug (S&P 1,050) to Nov (S&P 1,175) as costing the Fed about $30Bn a month to engineer and, when that began running out of gas (don't forget that formula that requires more and more fresh cash to sustain the rally), The Bernank stepped it up a few notches with QE2, which is putting 3x more money in each month for 6 more months. Already that has given us another 60 market points in 60 days but are we getting more bang for 333% more Federal Bucks or are we merely compressing the time-frame of the same effect?
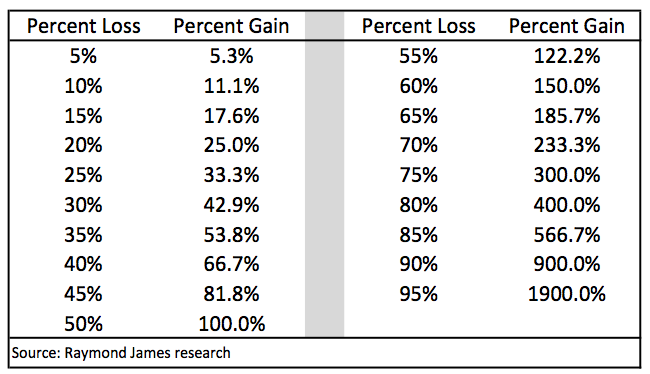 Briefing.com has a nice 2010 synopsis and sums up 2010 as a continuation of the recovery off 2008's 39% drop. As Barry Ritholtz points out with the chart on the left, losing 40% means you NEED 66.7% just to recover. It's also worth noting from this chart why 20% is our key inflection point in taking losses or adjusting – note how quickly things turn against you once you cross that line! Anyway, let's focus on the positive as we made our 11% gain DESPITE the following little set-backs:
The European Debt Crisis, the Flash Crash, the BP Oil Spill, Foreclosuregate, FinReg, South Korea and Republicans taking over Congress. That last one may be considered a positive by some but it was on their list too, along with the continued monetary stimulus from major Central Banks – even as many of our emerging markets began to slam on the brakes and tighten their own policies. This was offset by a 19% rise in global M&A with $728Bn worth of activity going on in the US but not much compared to 2007's $4Tn global total that was led by the US at the time. Briefing.com is optimistic and calculates the forward p/e of the S&P at 13.5x, assuming a 13% rise in earnings next year and we'll get our first indication of how well things are shaping up as companies report their Q4 earnings in January.
Oddly enough, the Airline industry was our top performing sector in 2012 with a 41.9% gain for the year with Consumer Discretionary #2 at 27%, pretty much tied with Transports and Industrials and closely followed by Retail (25.7%). Materials were "only" up 22.2% for the year despite the 81.2% rise in silver as gold was up "just" 28.8% as gold has gotten so expensive people are buying the 1/1,000th as rare and 1/50th as expensive silver instead because – well because people are kind of idiots – sorry, but there's no sugar-coating this one…
In the middle of the pack we had the Energy Sector, up 20.3% for the year, which is very interesting because Utilities performed poorly due to low demand by the same consumers with just a 5.5% increase. What's the difference? One sector uses meters to measure actual demand and one uses CNBC to make it up.
Our beloved Financials only gained 11.9% for the year, 4th sector from the bottom, beating out Info Tech (10%), Utilities and poor Health Care, who went up just 2.9% on a 17% increase in costs again in 2010. Just above Financials were Consumer Staples (14.1%) and Semiconductors (15.6%) to round out our sector list. Top stocks were a more diverse mix, with CAT leading the Dow with a 64.7% gain followed by DD (47.6%), MCD (22.9%) and who cares about the rest when NFLX gained 224.7% on the Nas followed by FFIV (149.4%), CMI (140.2%) and the resurrected AIG (91.9%). Honorable mention should go to CMG (146.1%), who were a letter short of making the Nasdaq and DECK (137.9%) who are still in the Midcaps.
Why were HPQ (-18%), CSCO (-15.5%) and MSFT (-8.7%) 3 of the 4 worst Dow performers if the Nasdaq and Semis did so well? MU (-25.2%) and WDC (-23.8%) were stinking up the S&P and NVDA (-19.8%), STX (-17.6%) and ADBE (-16,9%) were dragging the Nasdaq as 3 or it's 10 worst performers. This is a real flashback to 1999 when people who actually made technology underperformed people who had cool-sounding ideas (PCLN, NFLX, BIDU) by miles. That sure ended with a bang so I'm sure there's nothing to worry about here – even though it's kind of the exact same thing…
In 1999 it was venture capital money driving the markets through Silicone Valley but in 2010 it's Fed money driving the markets through Wall Street and Jr. Deputy Accountant does a great job of following the Billions, from Bernanke to Blankfein with a very nice run-down of the year's shenanigans. It will take another year of shenanigans for funds indexed to the S&P to get back to even. As Paul Price points out, index funds with $1M in January of 2007 gained 4% that year to $1,040,000 but then dove to $665,000 at the end of 2008, back to $825,344 in 2009 and clawing back to $932,639 as of December 29th – down "just" 6.74% after all that drama. Of course, the fund managers still get their fees so all is well I suppose.
All is supposed to be well in Retail Land but not, according to retail expert Howard Davidowitz, who says it's the top 30%'s spending that drove the season as they had a little relief rally (those that kept their jobs), especially the Financial sector professionals who were delivered a record round of bonuses from Uncles Ben and Lloyd this Christmas. Davidowitz points out it cost us $2Tn in debt last year to buy these gains and we've already committed another $2Tn in 2011 and what has it bought us so far?
- Walmart is 10% of US retail sales, has 150 million customers, and its stock it is down 6 consecutive quarters;
- Sears is the largest department store in America: "their stock is terrible"
- Best Buy had a huge earnings miss
- Toys’R'Us loss increased last quarter
- A&P filed bankruptcy
- Loehmann’s filed bankruptcy
- Charming Shoppes is going to close 100 stores
- TJMaxx just liquidated AJ Right
The biggest losers: commercial real estate landlords. Read REITs:
Landlords better start figuring it out pretty quick because they already have occupancy problems, rent problems and everything else right now. I don’t think the CRE problems are fixed by any means. That’s why we are going to close hundreds of community banks going forward, we are going to close hundreds more. Those CRE debts are coming due and they will not be able to be rolled over. We’ve got lots of problems still coming up in the banking system, and the problems in the real estate issue is here for a long time.
There's another major issue to watch in 2011 – if interest rates tick up, all kinds of crap is going to hit the fan! Dave Moenning does a nice job of reviewing which market truisms worked out in 2010 and it would do us all very well this month to remember that anyone on TV who says "As January goes, so goes the year" doesn't even remember that last January we were down 3.8% on the S&P so we can take that one with a huge grain of salt. We did set a new record for Bank Failures with 157 in 2010, ending the year with a bang on Friday with 6 final closings costing the FDIC another $600M and putting them $8Bn in the red for the year. Fortunately, we have been trained never to question the fact that the American People's $4.5Tn of cash on deposit is backed by an insurance fund that is $8Bn in the hole. I mean, what's the point of worrying about a potentially horrifying catastrophe you can't do anything about, right?
 Hale Stewart is downright cheery by comparison with his chart-fest entitled: "2010 – The Year we didn't Fall into the Abyss" while the Simple Accountant charts out some of the broader indexes and the intermarket relationships for a good rear-view look. Zacks' Steve Reitmeister got my attention with his 3 great lessons of 2010, which were: 1) Don't Fight the Fed 2) A Bird in the Hand is Better than Two in the Bush and 3) Timing the Market is a Fool's Errand. If Steve ever gets bored at Zacks, he can always come over and teach at PSW. As Steve notes: "I’m not swearing off market timing forever. I just think that I will do a lot less of it going forward. As long as the economic conditions are favorable to stocks, then I will stay heavily long the market as not to miss out on any of the major bull runs that can truly arise at any time."
Despite my annoyance at the overall Rupertization of the paper, the Wall Street Journal still puts out a large quantity of damn good articles and Tom Lauricella wrote one this weekend reviewing the year in Government intervention saying:
As was the case in 2009, investors can thank continued, unprecedented efforts by governments and central banks around the globe to keep their economies and financial markets afloat for those good returns… The benefits to investors could be seen in 2010. When major stock or bond markets faltered and ostensibly signaled alarm, policy makers responded aggressively with measures that, at least in the short term, directly or indirectly drove prices higher across a wide variety of asset classes.

At some point, Lauricella says, Governments will look to reverse their stimulative strategies as their economies and markets can stand on their own. But for now the betting is that in the U.S., Europe and Japan, at least, that support will continue for months to come. We can only hope that's the case – it is very possible that the massive stimulus of QE2, still in it's very early stages coupled with Obama's Trillion Dollar tax cut will be enough to keep the party flowing – all this despite many emerging markets trying their best to fight the Fed as well as the other loose Central Banks of the World – pretty much the same Keynes vs Hayek smackdown we've been tracking all year so I'll let the boys close it out for me:
Good luck to all of us in 2011 – we're going to need it. We already have our aggressive upside plays as well as last week's "Secret Santa Inflation Hedges for 2011" but there's a lot of cash on the side and, like Steve Reitmeister, we'd hate to miss out on the fun if this thing is going all the way to the moon before falling back to Earth.