

"Looking at my own reflection
When suddenly it changes
Violently it changes (oh no)" – Disturbed
Is the downturn anything to worry about?
Markets need corrections. Every once in a while, even in the greatest rally, some people need to actually take their profits off the table and realize some of those gains. It's often in the support levels we find during these sell-offs (when a volume of buyers show up), that we are finally able to discover the true price range of a stock. Apple (AAPL), for example, has goine from $125 in early June to $150 last week, which is up 20% and, according to our fabulous 5% Rule™, we expect a pullback of 20% of the run (weak) or 40% of the run (strong) so 5-point retracements to $145 or $140 and that's exactly what we're getting:
$150 for AAPL is over $2,500,000,000,000 in market cap. The 20% run added $500Bn to AAPL's PRICE (not value) and that's more than the TOTAL market cap of all but 12 companies on the planet. Did AAPL gain a Visa ($528Bn) or a Samsung ($462Bn) last month? It took those companies decades to climb to that valuation but AAPL can gain or lose it overnight? No, that's silly – the market is silly – don't take it seriously. This is a runaway market and not following the normal rules of investing.
Which is why we have our hedges (see last week's portfolio reviews). While the market was diving, we checked in on our paired Long and Short-Term Portfolios and found:
Well, the STP is sure working:
Value Change Today: $62,298
Security Value: $90,505 Cash on Hand: $159,569 Total Value: $250,074 Portfolio Ret.: 25.0% We're still net bearish, which is good as the LTP took a hit:
That's what's supposed to happen in a sell-off when you're bearish. Although much smaller, the STP gives us a lot of bang for the downside buck and we are very well-hedged for up to a 20% drop in the market so, on days like yesterday, we get to simply sit back and relax and see which of our stocks stay strong in a drop and which ones look scary enough to consider dropping. Most importantly, we have plenty of time to reflect and decide – no panic selling.
You'll notice we also have PLENTY of CASH!!! on the side of our portfolio positions and that too is a hedge. Having cash means we are able to make adjustments and, as long as there are no positions in your portfolio you wouldn't be happy to double down when they are 50% lower (there shouldn't be) what that means is a portfolio with 1,000 shares using 50% of the cash can become a portfolio with 2,000 shares and still have 25% of the cash left over. For markets that dip and recover like we had in March of 2020 – that strategy can make you a fortune.
This strategy does not work so well for high-flying stocks like TSLA – as we don't know what real value they have but, when you have value stocks like AAPL, DIS, F, GNW, GOLD, KO, M, WBA and WHR – like we have in our Butterfly Portfolio, you KNOW that 50% off would be ridiculous and, eventually, they will come back. Unless the World ends – in which case we assume there will be more pressing things on our mind than our portfolio's value. Our KO position is such:
| KO Long Call | 2022 21-JAN 45.00 CALL [KO @ $55.73 $0.00] | 15 | 5/28/2020 | (185) | $9,300 | $6.20 | $4.85 | $4.08 | $11.05 | $0.00 | $7,275 | 78.2% | $16,575 | ||
| KO Short Call | 2022 21-JAN 55.00 CALL [KO @ $55.73 $0.00] | -15 | 5/28/2020 | (185) | $-3,525 | $2.35 | $0.69 | $3.04 | $0.00 | $-1,028 | -29.1% | $-4,553 | |||
| KO Short Put | 2022 21-JAN 42.50 PUT [KO @ $55.73 $0.00] | -5 | 5/28/2020 | (185) | $-2,250 | $4.50 | $-4.03 | $0.47 | $0.00 | $2,015 | 89.6% | $-235 | |||
| KO Short Call | 2021 20-AUG 55.00 CALL [KO @ $55.73 $0.00] | -10 | 6/18/2021 | (31) | $-1,300 | $1.30 | $0.35 | $1.65 | $0.00 | $-345 | -26.5% | $-1,645 |
The crux of the position is the Jan $45/55 spread that's at the money and we sold 5 short puts so, IF KO falls below $42.50, we will be forced to buy 500 shares at $42.50 ($21,250). We spent net $2,685 (we took a loss on July short calls) on the $15,000 spread so our upside potential is $12,315 (458%) in 6 months if KO holds $55. On the downside, if KO drops 50% to $28, we would be forced to buy 500 shares at $42.50 and we'd lose our $2,685 (assuming we took no action).
Of course 50% off KO would drop their market cap to $120Bn for a company that has $35Bn in sales and $9Bn in profits. It's Coca-Cola, so we think even at the end of the World people will be drinking it so we'd happily double down, spending $14,000 for 500 more shares and then we'd have 1,000 shares at net $37.935 per share. Of course it would be at $28 and we'd still have a loss but, if KO comes back to just $45, we have a $7,000+ profit.
If we don't want to own 1,000 shares of KO at $37.93, we have no business committing to 500 at $42.50, right? That's how you should look at every investment you make. Are you ready, willing AND able to increase your position if it's down with the market (as opposed to being down for a specific, good reason)? If not, why are you buying the stock in the first place?
Markets do crash 20% and 40% and even 60% – we've seen it happen twice in the past 13 years, 3 times in the past 21 years so why should we be surprised when it happens and shame on us if we're playing the markets without a contingency plan for when (not if) that happens again.
So how do we know WHEN the market is going to crash? We don't. But we do know when it's over-valued and this one is VERY over-valued. That means it COULD crash any time or it could get much sillier – that's why we hedge. As long as Joe Biden and the Fed(s) keep throwing money on the fire – it can burn brightly for a very long time but it doesn't take much to spook and over-priced market – as was demonstrated yesterday.
Our 5% Rule™ let's us know where primary support and resistance zones tend to form and we saw weakness in the Russell (small caps) last week and we moved more of our hedges there – just in time. Not only is the Russell now at the May lows but so is the Nikkei, Euro Stoxx and Germany's DAX and China has already failed their lows so it stands to reason the US is simply lagging in the sell-off and we have more carnage ahead.
   
|
For the Nasdaq, back to May is a 10% drop, only 5% for the S&P and only 3% for the Dow. Below that would be a total nightmare as this market hasn't formed any proper support since the fall of 2020 and that was Dow 28,000 (-17.5%), S&P (-17.5%) 3,500, Nasdaq 12,000 (-17.5%) and Russell 1,600 (25%). That's why we doubled our Russell shorts – further to fall! Given those bases and using our 5% Rule™, we can discover where support should be on the way down.
- Dow 28,000 to 35,000 is 7,000 points so 1,400-point retraces to 33,600 (which we hit on the nose yesterday) and 32,200.
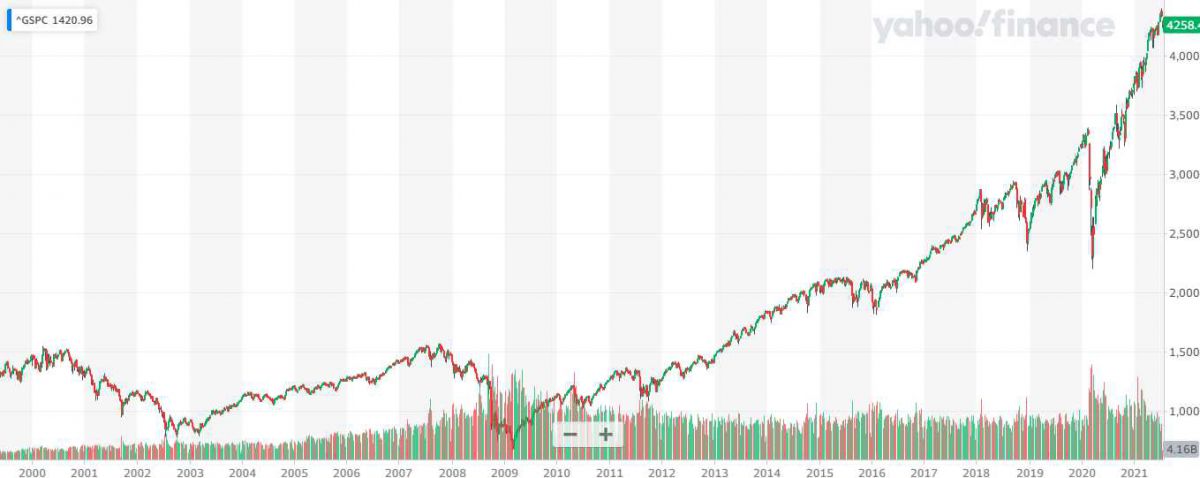
- S&P 3,500 to 4,400 is 900 points so 180-point retraces to 4,220 (yesterday's low 4,224) and 4,040.
- Nasdaq 12,000 to 15,000 is 3,000 points so 600-point retraces to 14,400 (14,445) and 13,800.
- Russell 1,600 to 2,350 is 750 points so 150-point retraces to 2,100 (on the nose!) and 1,950.
Remember, the 5% Rule™ is NOT T/A – it's just math. Just like science that people can't understand seems like magic, math that people can't understand seems like T/A but T/A is just as ridiculous as magic – remember that. I'm not going to get into the reason it works so well as we've done that before (see our Education and Strategy Sections). Suffice to say it's based on the predictable actions of trading algorithms, which is how we can be 4 for 4 predicting index pullbacks.
More useful now though, is how do we identify whether this was a mild pullback that's over or we're pausing for the next move down? We do that the same way we calculated the pullbacks though now we look for bounces off the pullback lines. If we get a strong bounce by day 2 (tomorrow) that holds (without breaking) for 2 full days – then the sell-off is over.
- Dow 35,000 to 33,600 is a 1,400-point drop so 280-point bounces to 33,880 (weak) and 34,160 (strong)
- S&P 4,400 to 4,220 is a 180-point drop so 36-point bounces to 4,256 (weak) and 4,292 (strong).
- Nasdaq 15,000 to 14,400 is a 600-point drop so 120-point bounces to 14,520 (weak) and 14,640 (strong)
- Russell 2,350 to 2,100 is a 150-point drop so 30-point bounces to 2,130 (weak) and 2,160 (strong)
   
|
Weak bounces are pretty much a given as we're in a very strong uptrending market and the FREE MONEY keeps pouring in every day so it's hard to stay down but the nature of this sell-off is a re-adjusting of economic expections for the rest of this year and, without EVEN MORE STIMULUS, we're not likely to find support so easily near the recent highs.
A strong market will make the weak bounce lines today than then test the strongs tomorrow. A weakening market will fail the strong bounces (or, even worse, fail the weak ones) and head back down to yesterday's lows, consolidate there and then fail and move on to the strong retrace lines but, below there and we have to then calculate the strong and weak bounce lines from the previous support (WAY LOWER) and hope that they hold.
Fortunately, we're hedged for that!