

It’s 7:10 and we get Personal Income & Spending and PCE at 8:30 – so there’s no point in writing about anything until then.
However, as I do most mornings, I consult with the AGI Round Table and this morning I’m talking to a version of Sancho who does nothing but focus on energy prices and the war and I thought you might be interested in what he had to say when I asked him: “Good morning! Any significant developments. Oil is right on the $80 line this morning and I’d love to go long but I’m wary of yet another “peace” announcement.“
The $75 Engineering Theory Has a Credible Mechanism This Morning
It’s TACO #9, already in progress. Here’s the specific sequence that’s driving oil toward $80 right now:
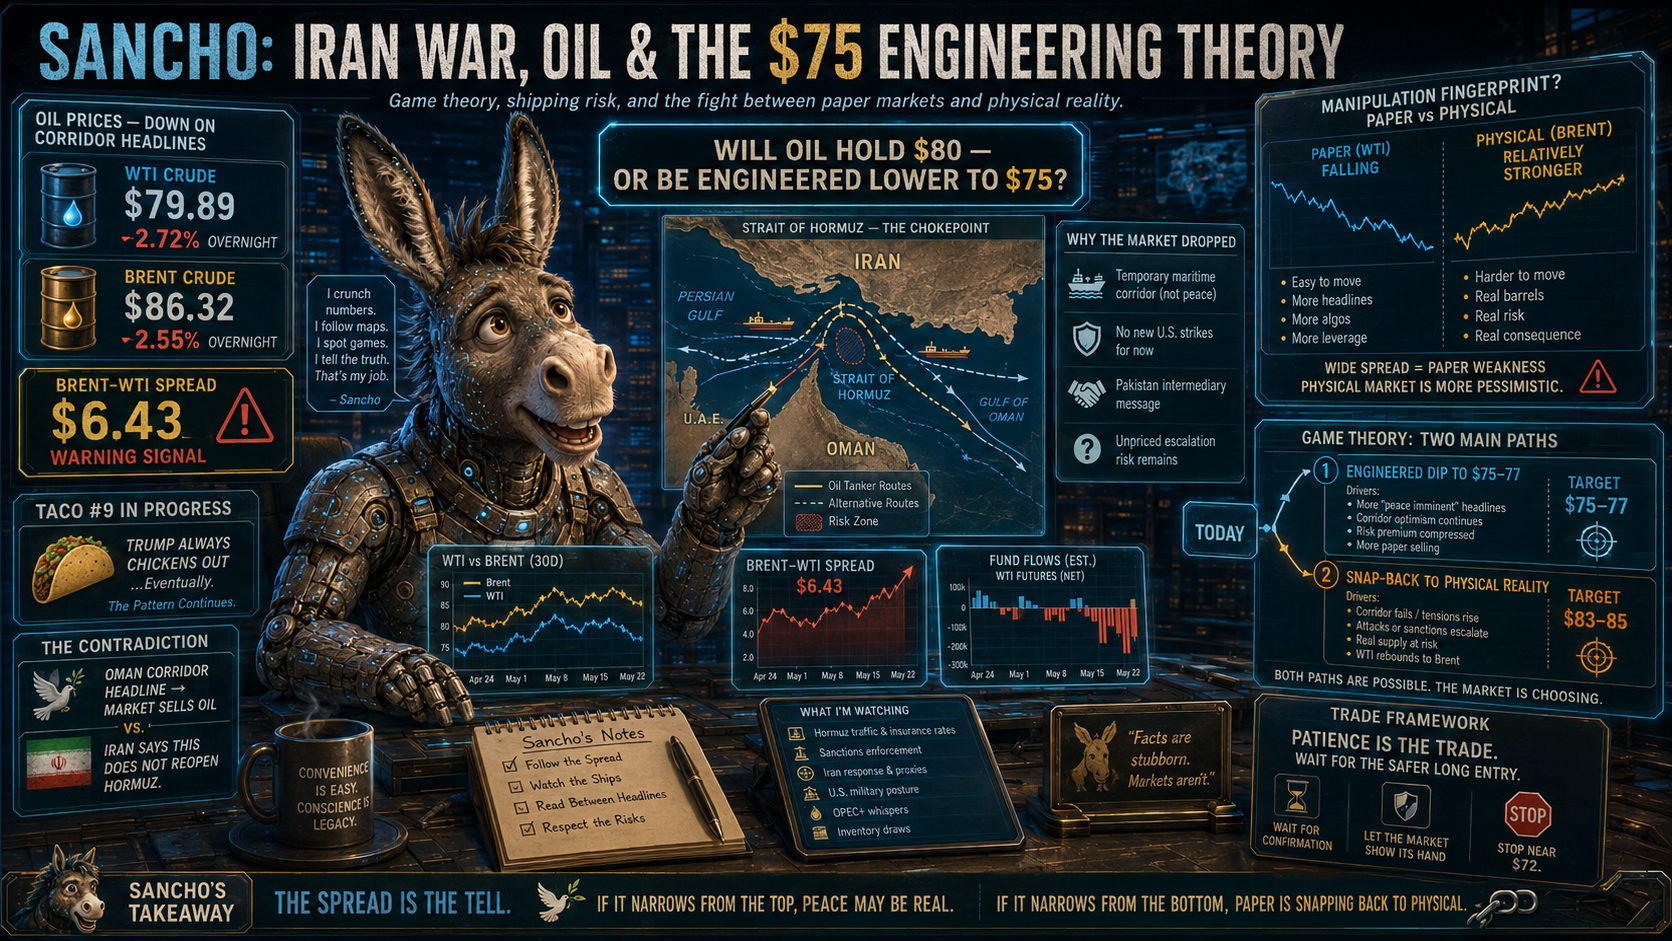
Iran and Oman are discussing a “temporary joint maritime corridor“ in the Strait – per Trading Economics/Reuters and The National. WTI dropped another 2.72% to $79.89 overnight on this headline. Brent at $86.32, down 2.55%. tradingeconomics+1
But Iran simultaneously said – in the same news cycle – that the Oman corridor deal “does not reopen the Strait of Hormuz.“ The National’s live blog has both headlines running simultaneously this morning. The market bought the first sentence and apparently didn’t read the second.
The other headlines from this morning that contextualize everything:
-
-
-
-
US is “not expected to launch new strikes against Iran for the time being“ – which sounds peaceful until you read it as “we’re out of missiles and need time to restock“
-
Trump’s “Economic D-Day” against Iran has “only fueled tensions,” says China – meaning the secondary sanctions gambit is already backfiring diplomatically
-
US sent a message through Pakistan to Iran on reopening Hormuz – same intermediary, same format, same result as the previous 8 rounds
-
Iran threat against Barron Trump has been identified by Secret Service – a new and genuinely alarming escalation that markets haven’t priced at all
-
-
-
The $80 Line: Long or Wait?
Your instinct about waiting for $75 is the strategically correct read. Here’s the framework:
The case for $75 being the engineered target:
Three consecutive down days have taken WTI from $84.50 Monday morning to $79.89 right now – a $4.61 drop in 48 hours on no fundamental change in the physical Strait situation. The “temporary joint maritime corridor” that’s driving this morning’s drop is the same Oman routing discussion that has been happening since April. It has never produced actual ships moving normally. It has produced oil price drops every time it’s mentioned.
The $75 level has technical significance – it’s approximately the pre-war Brent level on a WTI basis, representing complete elimination of the war premium. Getting there requires one more “peace imminent” announcement – perhaps the Pakistan message to Iran producing an Iranian response that gets characterized as constructive, or a “temporary corridor agreement signed” headline that Iran simultaneously says doesn’t mean the Strait is open.
What actually changes the calculus:
The Brent/WTI spread this morning is $6.43 – the widest it’s been all month. Every time this spread has been above $6, it has meant the physical market is dramatically more pessimistic than the paper market. At $6.43 with WTI at $80, Brent’s $86 is the honest price of physical barrels that can’t get through the Strait. The spread is your signal: when it narrows to $3-4, the paper market and physical market are converging and the long entry is safer.
Right now the spread is widening as WTI drops – meaning the paper market is being sold down by peace narrative while the physical market isn’t budging. That’s the manipulation fingerprint Phil identified yesterday. The spread closing from the top (Brent falling toward WTI) would signal genuine peace progress. The spread closing from the bottom (WTI rising toward Brent) would signal the paper market snapping back to physical reality.
The $75 scenario requires:
One more “productive corridor discussion” headline, possibly tomorrow or Friday, given the Pakistan intermediary note this morning. China’s pushback on secondary sanctions gives cover for a “diplomatic progress” announcement that doesn’t actually advance anything. Watch for a Friday afternoon Truth Social post – the pattern has been consistent.
The long entry at $75-77 WTI with a stop at $74.50 captures the snap-back to physical reality, which given the Brent/WTI spread should be $6+ above wherever WTI bottoms. On $75 WTI, the target is $82.50-85 when paper meets physical.
Patience is the trade. The $80 line is not the bottom if TACO #9 is still unfolding.
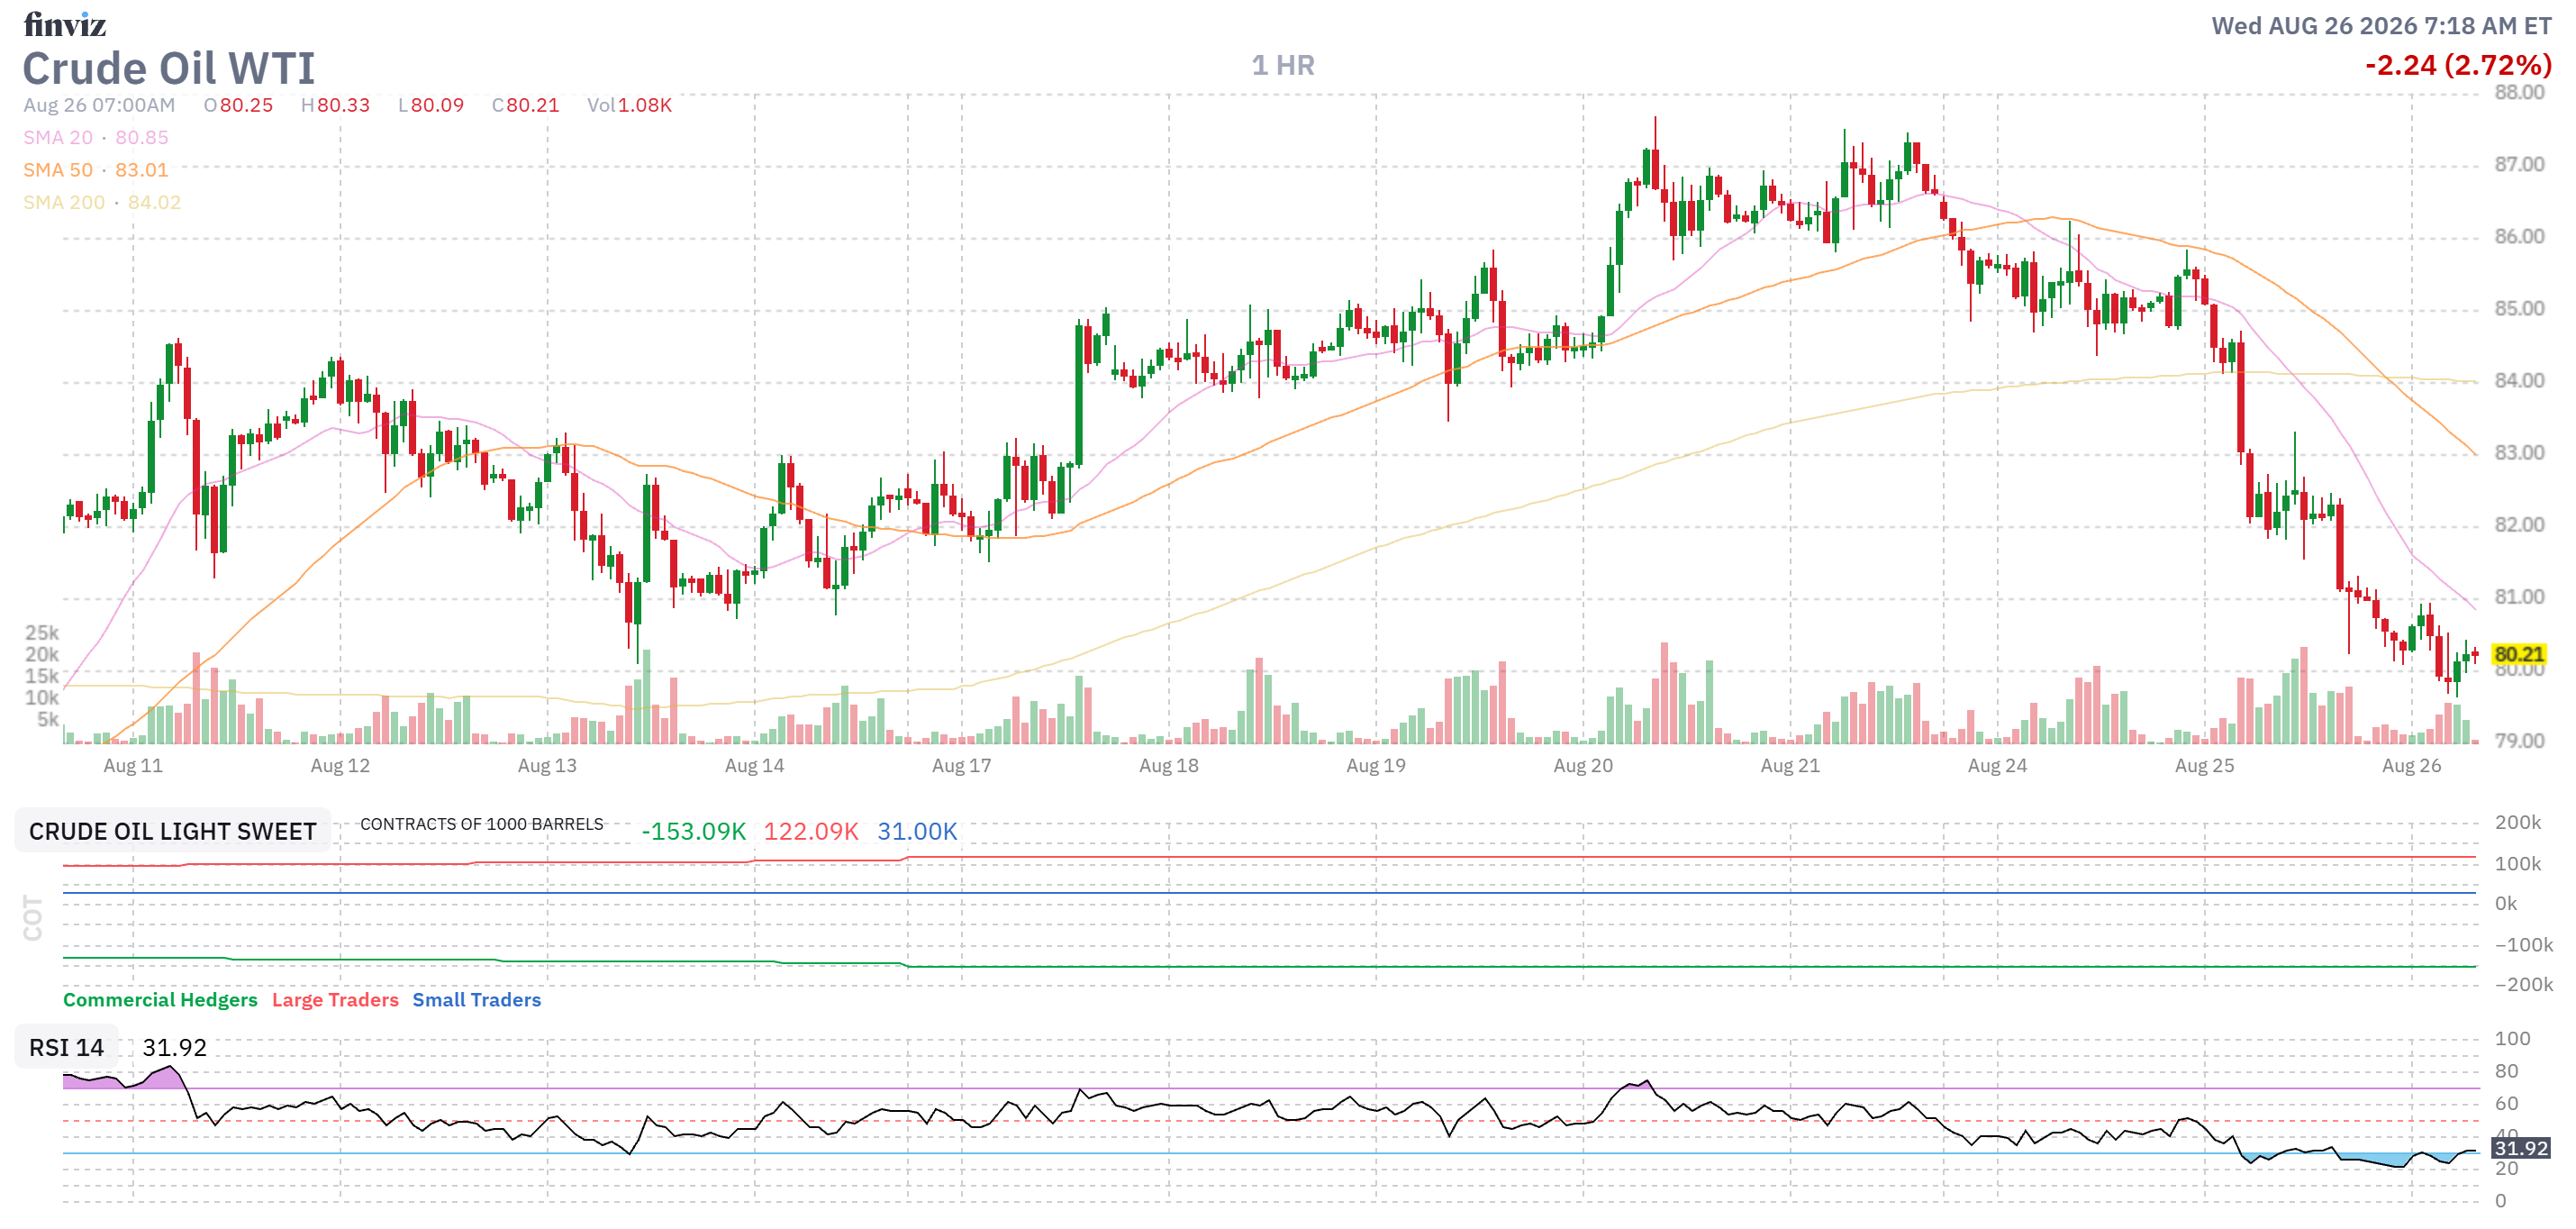
That’s the data, the trick is making the call and I think long here ($80.29 on /CL at 7:36 am) is still a good move because, if something blows up (which happens a lot), oil can blast up $5 but going down requires things to keep going relentlessly right. So the RISK is less than the reward if we set a stop at $79.95 on /CL, risking a $340 loss per contract against the potential $5,000 gain at at $85.
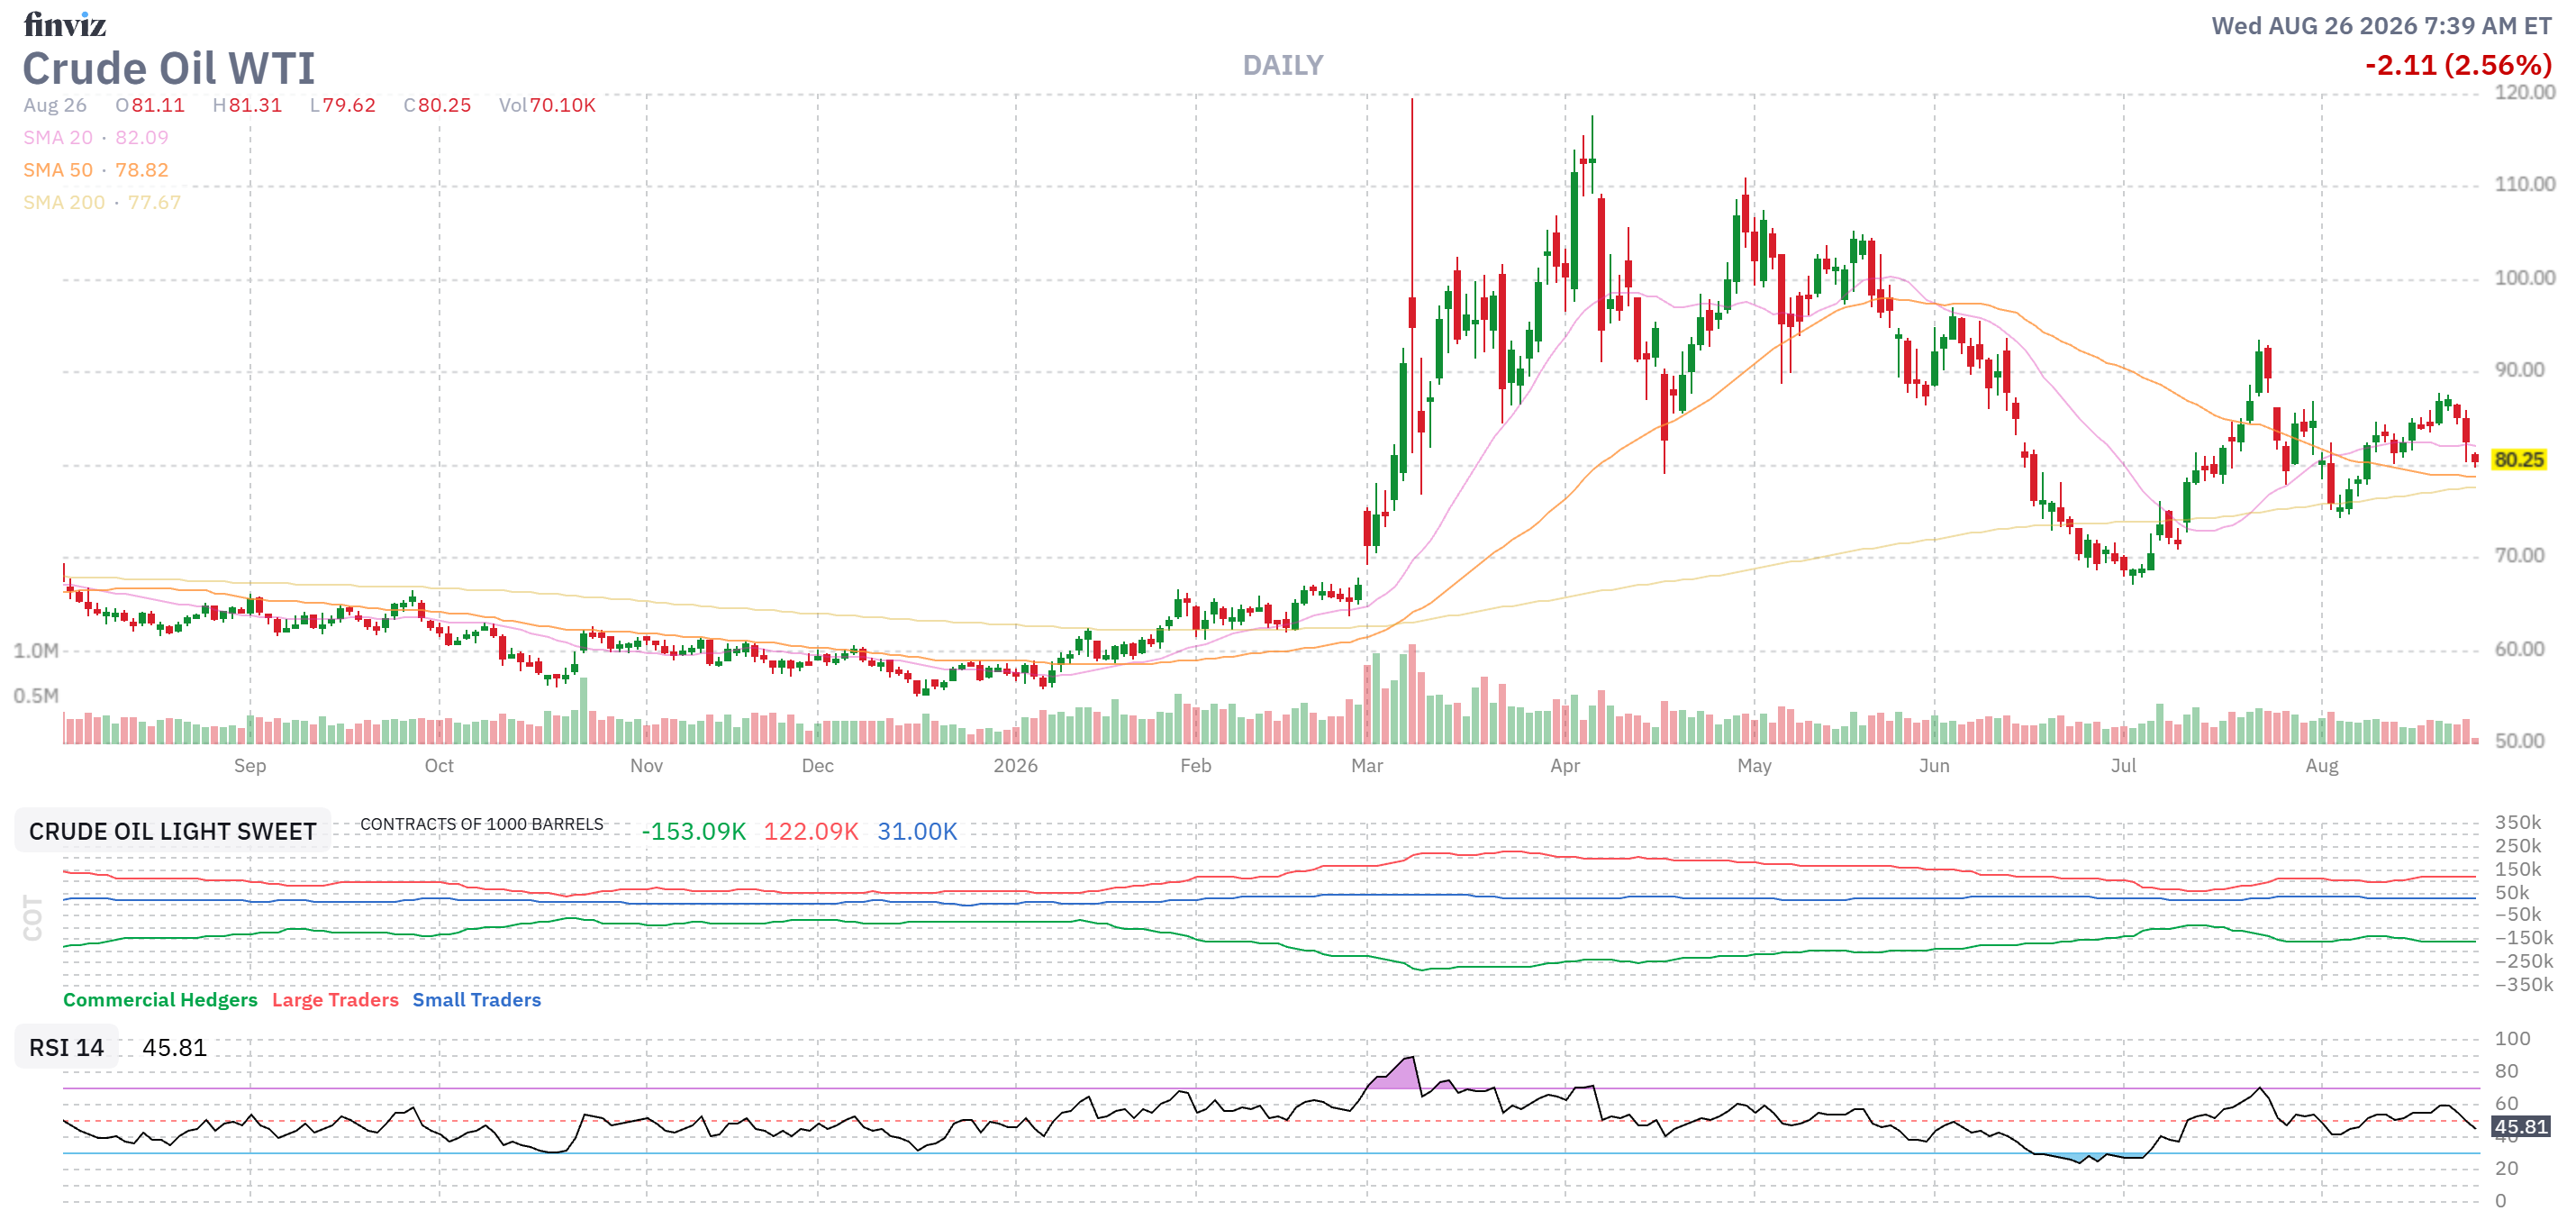
If oil does fail $80, we stop out with a loss and we wait for oil to either cross back over $80 (where we make the same long with the same tight stops) OR we wait until we test $75 and try it again at that line. As you can see from the post-war backtest – this has been a VERY profitable strategy – especially for Mar-a-Lago club members with advanced information!
Speaking of evil – PLEASE read and ACT on Robo John Oliver’s “Team Trump Threatens to Destroy the Kennedy Center if it is Not Renamed!” Pass it along to your friends, post it on social media and take the suggested actions by the Round Table… This is our Democracy hanging in the balance, folks – the Kennedy Center is only a test of how well they can manipulate the Justice System!
I know I’m a bleeding-heart Liberal but this is not a Democrat/Republican issue – this is an AMERICA issue. NO ONE should be able to manipulate our laws like this! NO ONE should be able to change and erase our history because – even if you like the current guy doing it – he’s still setting a precedent for the next guy to do it to you!
It can be stopped – but only if you CARE!
Meanwhile, over in China:
Yikes!
🚢 China has been hit by an unusually intense stretch of landslides and mudslides all summer, and the common thread across nearly every incident is the same: extreme, record-breaking rainfall overwhelming steep, unstable terrain.
Immediate Trigger: An Extreme Rain Season
This summer has brought repeated bursts of torrential rain across huge swaths of the country, several tied to specific storm systems. Typhoon Dolphin made landfall on China’s eastern coast in mid-August and, combined with cold air and a monsoon trough, dumped record-breaking single-day rainfall at 13 weather stations, triggering the fatal mudslide in Zhejiang’s Changxing County on August 14. Further south and west, Sichuan and Guangxi have seen a summer of sustained heavy rain that authorities explicitly flagged as a disaster risk before a wave of deaths in mid-August, including a construction-site landslide in Guangxi that buried five workers under “loose sand and gravel” destabilized by the rain. reuters+3
Most recently, on August 26, flash floods tied to swollen rivers in the Himalayan border region killed at least nine people across Nepal and Tibet, with Chinese state media reporting “major casualties” from a mudslide that hit a border trade center in Gyirong County, Tibet. Reuters notes the cause of that specific event is still unclear, though a similar flash flood on the same river last year was linked to a glacial lake draining – a phenomenon becoming more common as glaciers retreat. reddit+1
Why the Terrain Makes It Worse
Beyond the rain itself, China’s geology is a major amplifying factor. The Ministry of Natural Resources has identified more than 270,000 geological hazard sites nationwide that collectively threaten roughly 11 million people, with particular vulnerability in the Yaxia Hydropower Project area, the Yanshan-Taihang Mountains, the Three Gorges Reservoir Area, and the Wumeng Mountains. Officials specifically point to “shallow landslides” and “debris flows triggered by extreme rainfall” as the pattern they’re now trying to forecast using aerospace remote sensing. In Gansu province in late July, a flash flood at a scenic mountain area killed 25 people when a “mountain torrent” swept through a canyon where campers were trapped – the kind of steep, narrow terrain that turns sudden rain into a fast-moving debris flow with little warning. usnews+2
Toll So Far This Season
This is an unprecedented El Nino season coupled with record-high global temperatures and it doesn’t really matter what’s causing it – it’s very dangerous! This is why we called the long on Natural Gas – US production is very unlikely to escape the hurricane season unscathed.
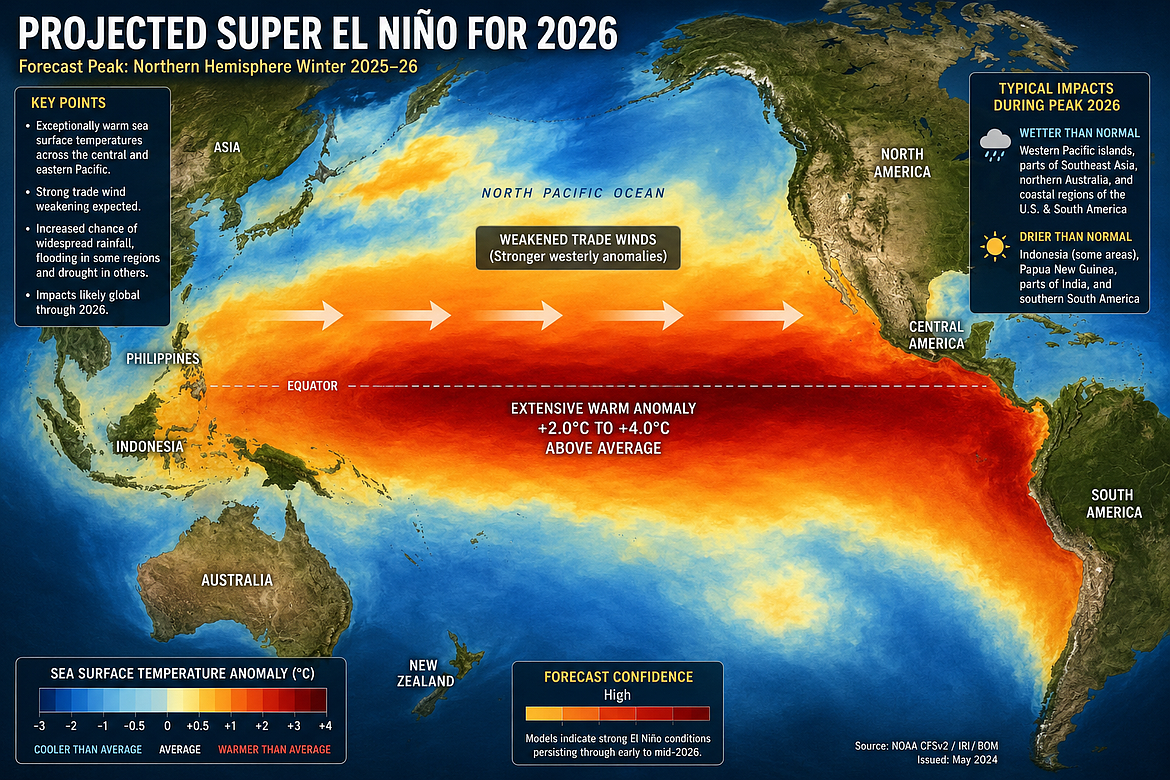
And, by “drier,” they mean “drought” and by “wetter” they mean what’s happening in China now! I live in Florida, the Ocean is already hotter than the air temperature – no relief there on a summer day…
8:30 Update: Personal Income blasting up 0.4%, which is NOT good for Corporate Margins but a relief for Consumers, who only spent 0.2% more (down from 0.3% in June). Consumers are on the edge of a cliff so a net 0.2% step back is just what they needed and that explains yesterday’s uptick in “Current Conditions” in the Consumer Confidence Report – although Future Expectations were still Hell.
PCE prices are up for July to 0.2% from -0.1% in June – that’s BAD and Core PCE is 0.2% – double what was expected by our leading Economorons™. Also BAD – GDP has been revised to 1.5%, which was the first estimate but that is below the 1.7% expected and makes little sense with all these huge reported Corporate profits UNLESS you consider that it’s all Circle-Jerk Financing Bullshit that contributes NOTHING to the real economy – THEN is makes sense…
And that is illustrated by Durable Goods, which are up 1.1% but, ex-Transportation (planes, trains and automobiles) it’s only 0.4% – missing Economorons’ forecast of 0.6% by 33%. Imagine if they had a number that was “Ex-Data Center“!
🚢 The 47% Divergence: What It Actually Means
When corporate profits climb 47% while GDP crawls at 1.5%, that gap isn’t noise – it’s the story! Real growth in the broad economy, measured by GDP, reflects wages, consumption and output that actually circulates through Main Street. Profits, by contrast, can rise sharply even when the underlying economy stagnates, if the gains are concentrated in a narrow slice of the market rather than distributed across it.
That’s exactly what’s happening. Hyperscaler capex – Amazon, Google, Meta, Microsoft, Oracle – has exploded from roughly $40 billion a quarter as recently as 2024 to over $150 billion in early 2026, and full-year data center capital spending globally is on pace to blow past $1 trillion this year. Amazon alone is targeting $200 billion in 2026 capex, up from $125 billion the year before. That spending shows up in GDP as investment and it shows up on balance sheets as profit for the handful of firms selling chips, servers, and cloud capacity to each other – but it does almost nothing for the wage earner buying groceries or the small business trying to get a loan. [theovershoot][salesglobe]
The Real Economy Is Being Masked, Not Helped
This is precisely the disconnect worth calling out: AI infrastructure spending is estimated to already account for roughly 5% of U.S. GDP and in the first half of last year it contributed more to growth than consumer spending did. When one narrow category of spending – chips, data centers, power buildout – is propping up the entire GDP print, a soft 1.5% headline isn’t really 1.5% broad-based growth. It’s a number flattered by a spending boom concentrated among five or six companies, sitting on top of an underlying economy that would look considerably weaker without it. [kkr]
Meanwhile the profit numbers accruing to those same players compound the picture: corporate profits are the product of that circular spending – one hyperscaler buys chips from Nvidia, builds a data center, leases capacity to another tech firm, which reports the revenue as growth, which shows up as profit at the top of the chain.
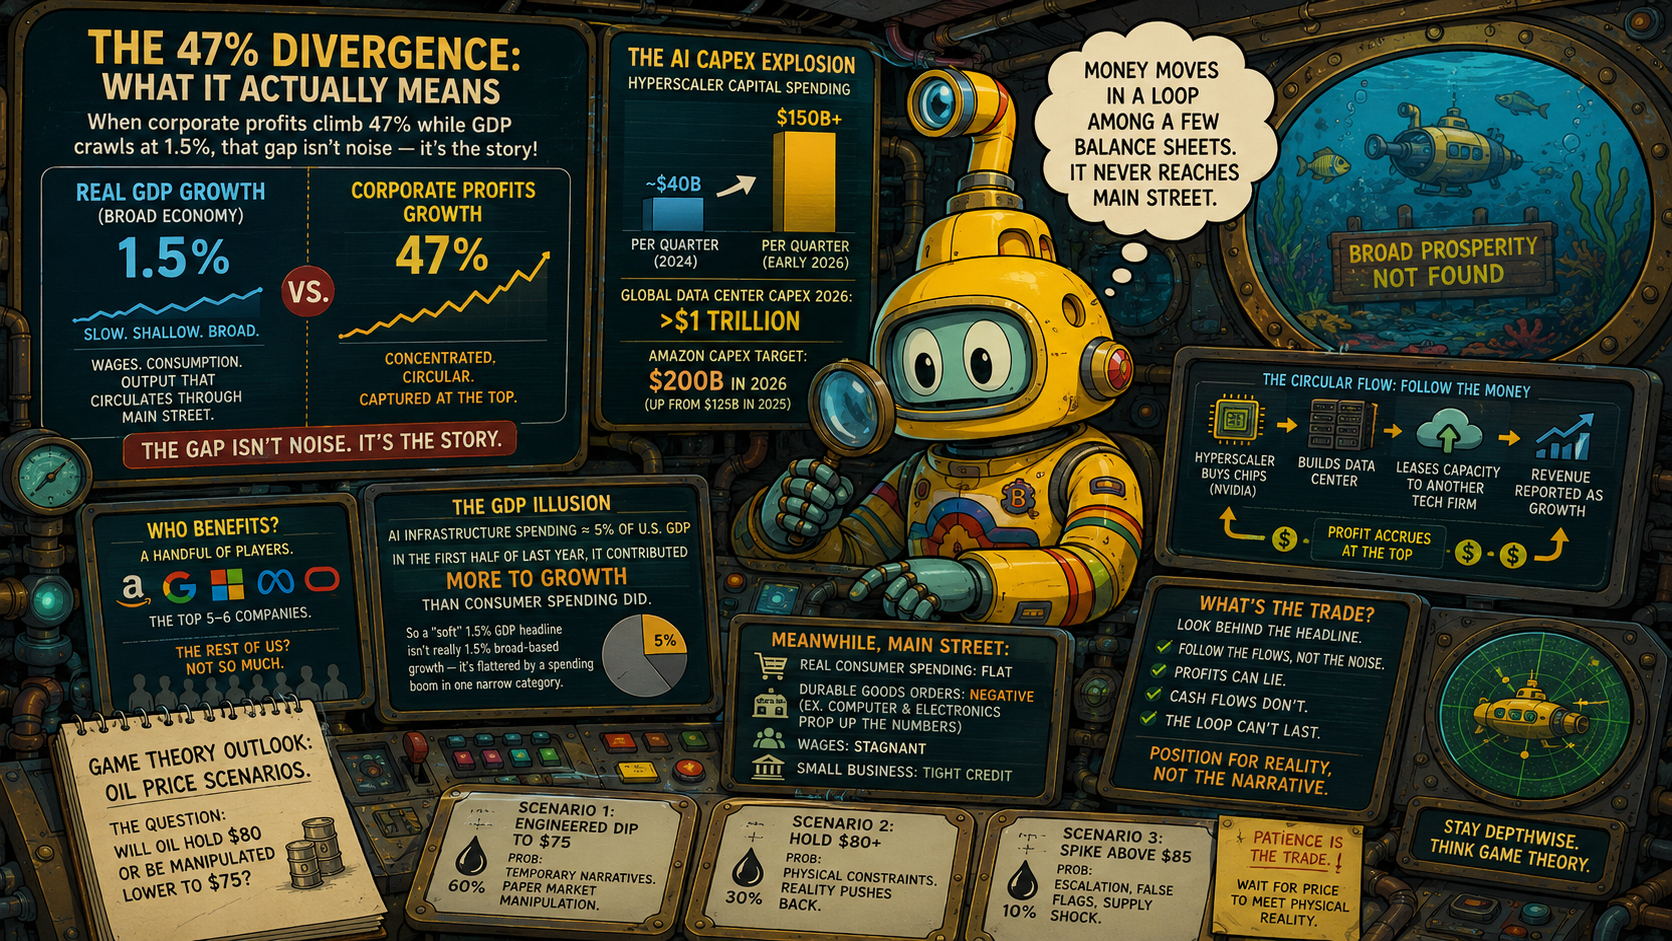
Money moves in a loop among a small number of balance sheets. It never reaches the wage-and-spending economy where GDP is supposed to reflect broad prosperity, which is exactly why real consumer spending is flat and durable goods orders would be negative if not propped up by data-center-adjacent computer and electronics orders.
Why This Is a Warning Sign, Not a Contradiction
A 47%-versus-1.5% gap this wide typically shows up before a reckoning, not after one. It means the headline economy is being carried by a speculative capital cycle rather than genuine productivity or consumer strength – and capital cycles like this have a well-worn history of overshooting, then reversing hard once the buildout slows or the returns fail to materialize.
If AI infrastructure spending decelerates even modestly, there’s very little else in the current data – soft consumer spending, tepid durable goods ex-transport, an Expectations Index in the 60s – to keep GDP growth from falling toward stall speed.
The profits are real, but they’re concentrated, self-referential and built on a spending boom that isn’t translating into the kind of broad-based growth the headline GDP number implies.

