
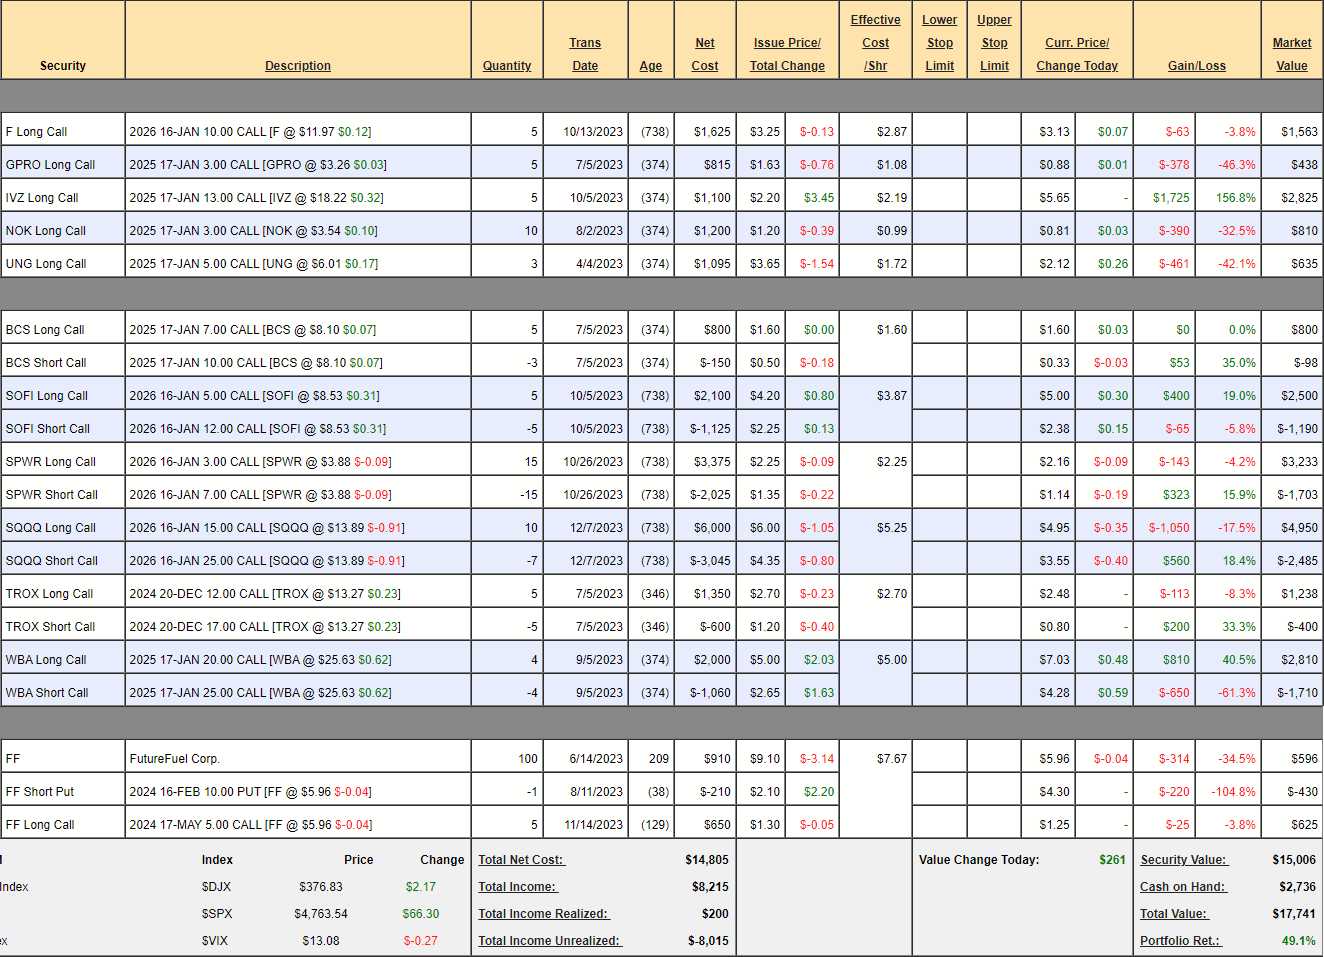
 $17,741!
That’s up $2,314 (13%) since our last review and up 58.4% in total since our August 25th, 2022 start. It’s been a really good month and we’re still on pace to make $1M in more like 150 months than 360 but let’s not get too complacent. Still, this is exciting and we’re sitting on $2,736 in CASH!!! with $1,000 set aside for margin (we assume IRA/401K with no margin multiple ability) and we’re adding another $700 this month, which gives us $3,436 in total buying power!
If you are just getting started on your path to being a Millionaire – you haven’t missed very much at $15,427 and you can go over months 1, 2, 3, 4, 5, 6, 7, 8, 9, 10, 11, 12, 13, 14, 15 and 16 to see all the moves we’ve made to get this far. This is a small portfolio, which means we can’t use all of our favorite option techniques yet – but it’s a great way to learn how to get started on a wealth-building adventure.
Last month, the only position we touched was our SQQQ hedge and we’re still playing a bit defensively but we should put some of that cash pile to work.
-
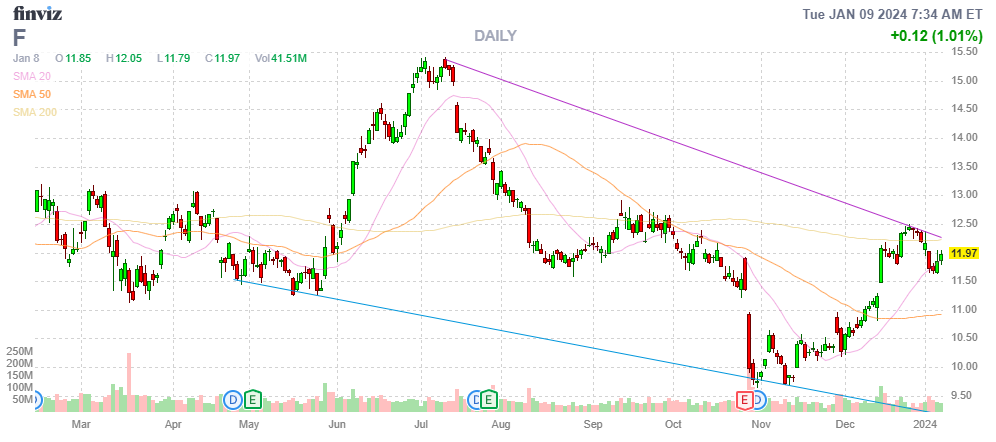
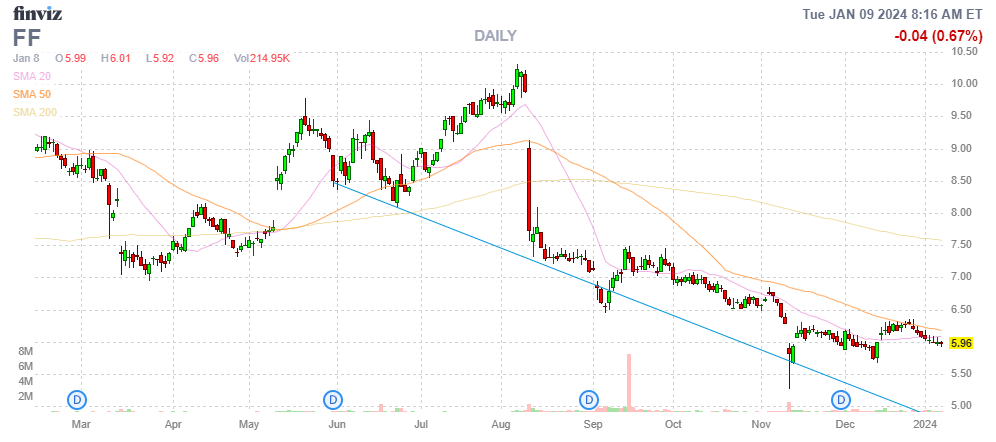
- F – That falling top of the channel was resistance on the 25% run from $10 to $12.50. Using the 5% Rule™ (not at all TA), we have a $2.50 pop so we expect 20% retraces of 0.50 each so $12 is a weak retrace (nothing at all to worry about) and $11.50 is a strong retrace. We bounced off $11.50 without touching it so I think we’re just consolidating for a move higher. Our target price is $14, which would be $2,000 for an upside potential of $877 (56.1%).
-
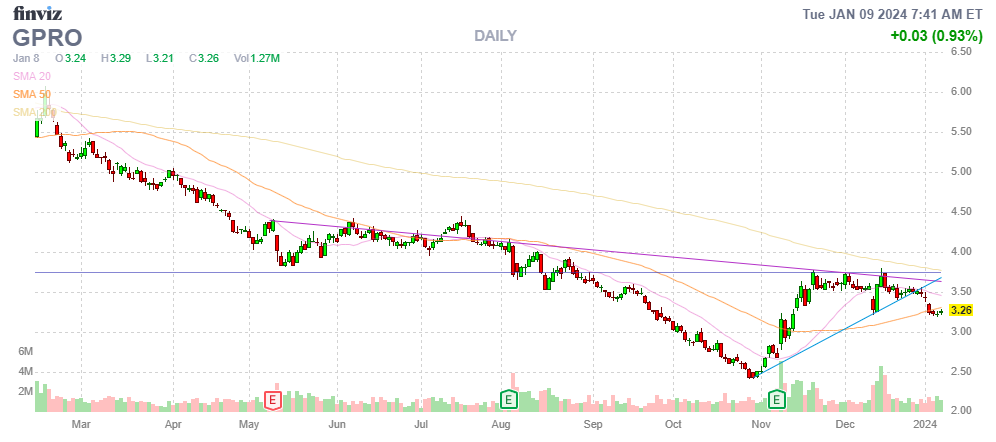
- GPRO – We’re waiting on earnings. Our target was $6 but we only have a year to get there now – so they need to show us something. Doesn’t get an upside potential since we’re losing faith…
-
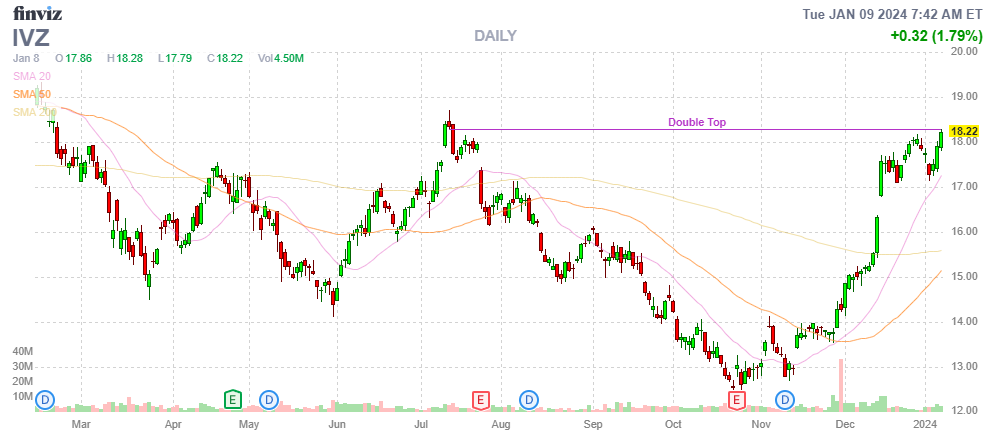
- IVZ – We’re going to cash these in after a great run – up 156.8%. We’ll find something else to play with $2,825!
-
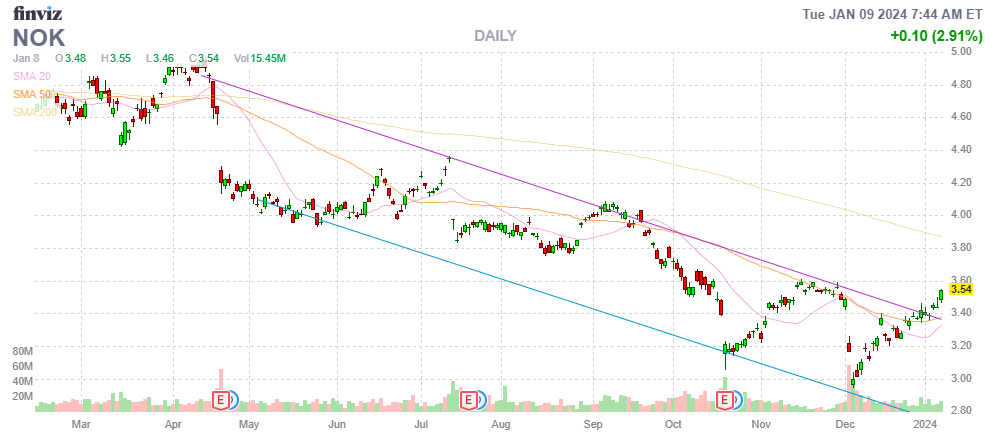
- NOK – Going our way – we’ll see how far. Our target is $5 but maybe not this year so let’s say $4 and that turns our $810 into $1,000 for $190 upside potential – not very exciting but we’ll see how earnings look.
-
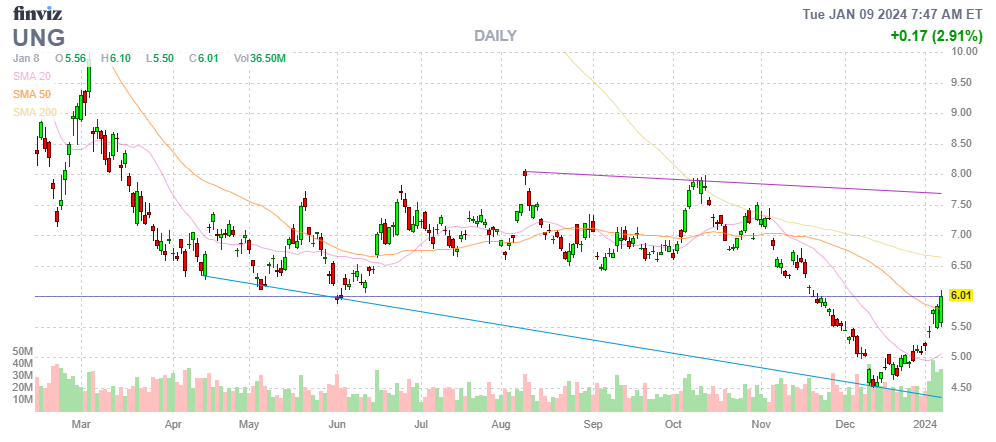
- UNG – Last March it was $10 so this is a gamble that there will be a cold winter or Russia will mess with Europe’s gas again. If we’re not over $7.50 by March, we’ll be done with this and I’m not counting on the upside here.
-
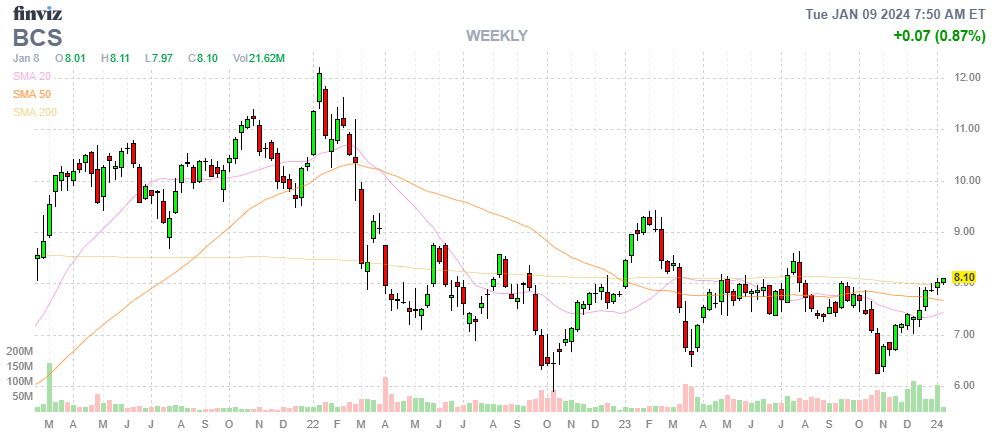
- BCS – I’m using the weekly chart to illustrate where they were pre-crisis. It wasn’t their crisis – it was other banks and it’s left Barclays very under-valued. $10 would be $1,500 and it’s currently net $702 so $798 (113%) upside potential.
-
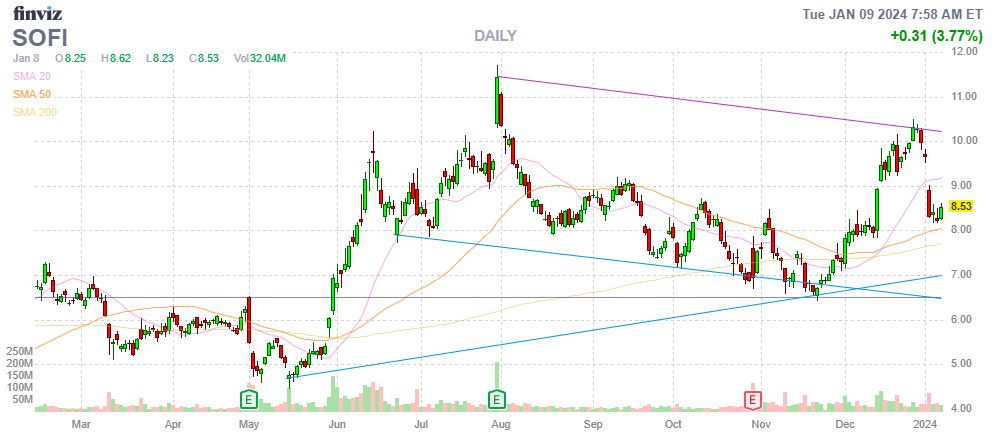
- SOFI – We’re confident in our $3,500 (at $12) goal and currently net $1,310 so $2,190 (167%) upside potential is great for a new trade.
-
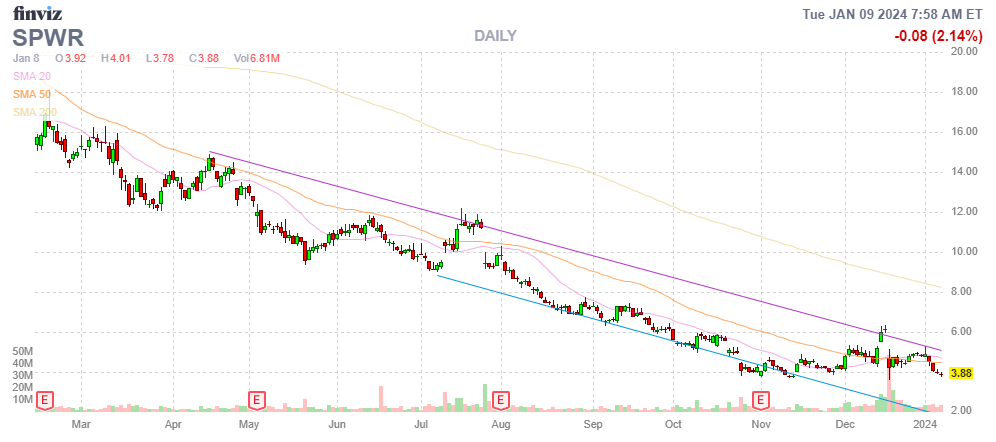
- SPWR – They have a lot of problems and this is not a portfolio for gambling or I’d get more aggressive but there is a potential for loss here and we’ll see what happens with their earnings as I don’t believe things are as dire as they are being painted.
-
- SQQQ – At $13.89 a 20% drop in the Nasdaq would be a 60% pop to this 3x Inverse ETF and that would be $22.22 so net $7.22 or $7,220 and currently the net is $2,465 worth of protection. The 2026 $10 calls are $6 so it would be silly not to roll down for $1.05 ($1,050) and that would add net $3,950 more protection and we’ll be $3,890 in the money.
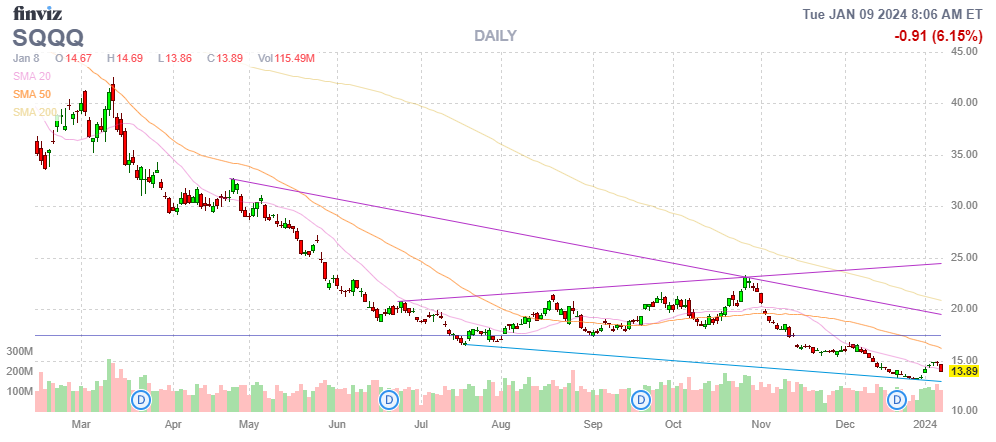
When you have a good run (+$2,314 this month) it’s always a good idea to throw a little more money into your hedges. That locks in your gains and allows you to go shopping with confidence! This is a 2-year insurance policy and the money we’re investing is dwarfed by the upside potential of the longs.
-
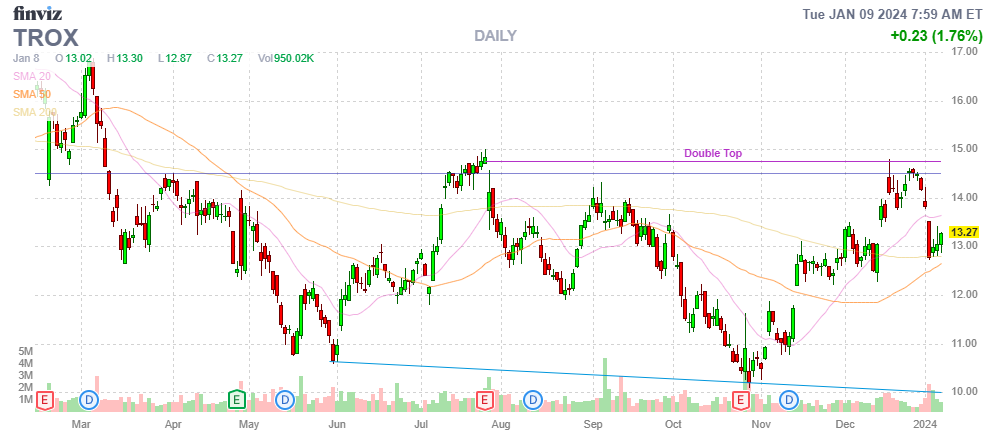
- TROX – Took a step back after testing the top of the channel but third time should be a charm if earnings hold up. At $17 it’s a $2,500 spread, now net $838 so $1,662 (198%) upside potential and the spread is $660 in the money from here!
-
- WBA – Had a crazy week but recovering now. Makes me more confident this is a bottom and we’re already at our goal, which would pay out $2,000 at $25 and it’s currently net $1,100 which means we have $900 (81%) upside potential.

-
- FF – How can we be losing on the short puts and the short calls – that seems unfair! We sold aggressive puts and we’ll roll them out next month. Another one where we’ll have to wait for earnings.
We gained net $1,775 in CASH!!! from our two adjustments so now we have $5,211 available for new positions. Our existing position have $6,617 (37.3%) of upside potential over 2 years and we need to double that (doesn’t have to be right now) to stay on the great track we’ve been on for the first 16 months.
Going back to the Dec Portfolio Review, I strongly liked (that we don’t already have) BBY, CROX, CSCO, DIS, FL, GOLD, LEVI, MDT, PARA, PFE, SQ, T, and VALE. Most of them are too big but PFE is obvious and LEVI was a Trade of the Year Runner up and VALE was the winner so let’s look at those:
VALE – At $15.27, the 2026 $10 calls are $5.60 and the $15 calls are $2.55 so net $3.05 on the $5 spread has net $1.95 (63.9%) upside potential and that’s OK but the $12 calls are only $4.15 so the $12/15 spread is only net $1.60 and those have $1.40 (87.5%) upside potential so a much better play with the same target. Officially, let’s:
-
- Buy 10 VALE 2026 $12 calls for $4.15 ($4,150)
- Sell 10 VALE 2026 $15 calls for $2.55 ($2,550)
That’s net $1,600 on the $3,000 spread with $1,400 (87.5%) upside potential if they can simply hold $15 into 2026 – aren’t options fun?!?
If we could sell puts I’d love to buy PFE stock but we can’t afford the margin so let’s just go with a spread:
-
- Buy 5 PFE 2026 $30 calls for $4 ($2,000)
- Sell 5 PFE 2026 $35 calls for $2.35 ($1,175)
That’s net $825 on the $2,500 spread with $1,675 (203%) upside potential at $35.
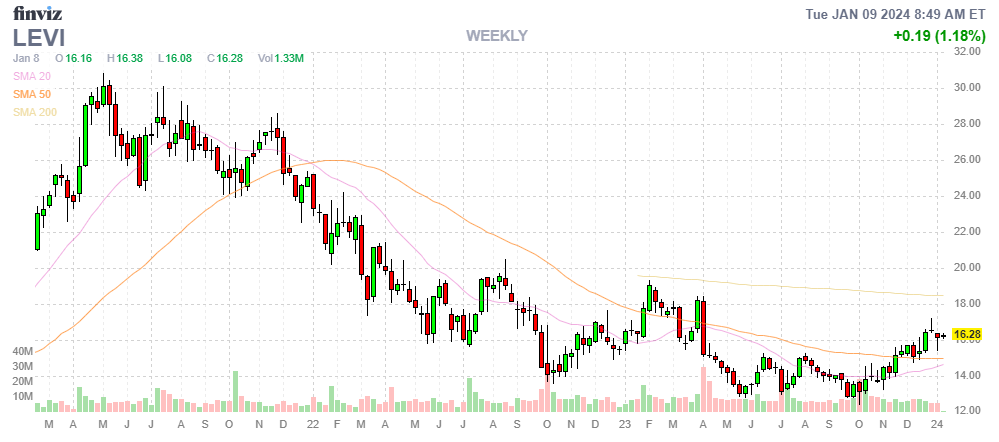
I don’t want to spend too much money but LEVI has the same general logic as CROX and they just guided up so let’s not miss that train:
-
- Buy 5 LEVI 2026 $12 calls for $6 ($3,000)
- Sell 5 LEVI 2026 $20 calls for $2.50 ($1,250)
That’s net $1,750 on the $4,000 spread so we have $2,250 (128%) upside potential at $20 and we’re starting out $2,140 in the money with no margin – options are fun!
We spent $4,175 on 3 new trades that added $5,325 of upside potential – close to doubling what we had so now we have a very respectable $11,942 (67.3%) of upside potential over the next two years but this year is only getting started and we have $1,036 left to spend and another $700 will be added next month and, best of all, we now have $6,415 worth of downside protection as well – I will sleep well on this portfolio!

 of the S&P 500 Worth $21.5Tn Are Reporting!")


