
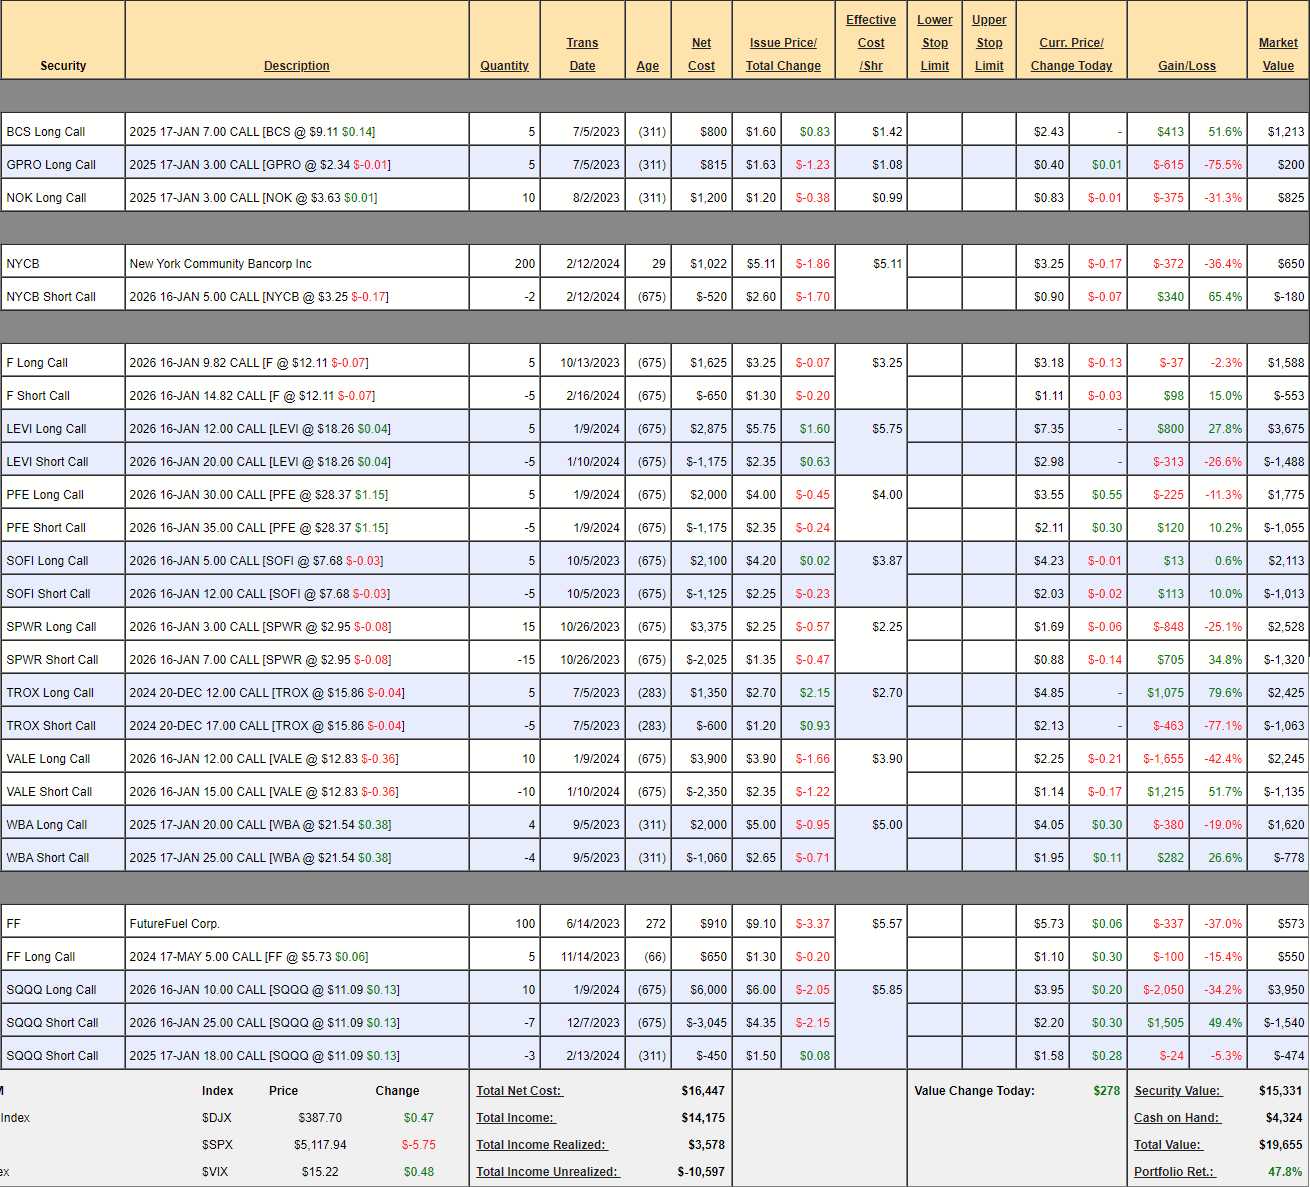
 $19,655!
Including this week’s $700, we have a starting basis of $13,300 since Aug 25th, 2022 and a profit of $6,355 (47.8%), which is miles ahead of our 10% annual goal. Even better, we decided not to buy any new stocks last week so we’re sitting on $4,324 and we have NO margin requirement – it’s all deployable!
At this pace, call it 30% per year, it will only take us 13 years to get to our $1M goal but, so far – you haven’t missed much as we’re effectively going to take $19,655 and make $1M over the next 12 years! You can go over months 1, 2, 3, 4, 5, 6, 7, 8, 9, 10, 11, 12, 13, 14, 15, 16, 17 and 18 to see all the moves we’ve made to get this far. This is a small portfolio, which means we can’t use all of our favorite option techniques yet – but it’s a great way to learn how to get started on a wealth-building adventure.
As of our last review on Feb 9th, we had $14,551 of upside potential in the existing trades, that would be good for another 74% gain over the next two years (if all goes well) but of course we’ll be adding new trades along the way. The positions we had last month gained $1,875 (10.5%) and the S&P was at 5,004 that day and now 5,117 so up 113 is 2.2% – so we’re outperforming quite nicely!
-
- BCS – Doing well and we think they have room to run.
- GPRO – They got killed on earnings and we can only HOPE they recover by the end of the year. Profits were a beat but on declining revenues and cutting their way out of trouble is not likely to be a long-term solution.
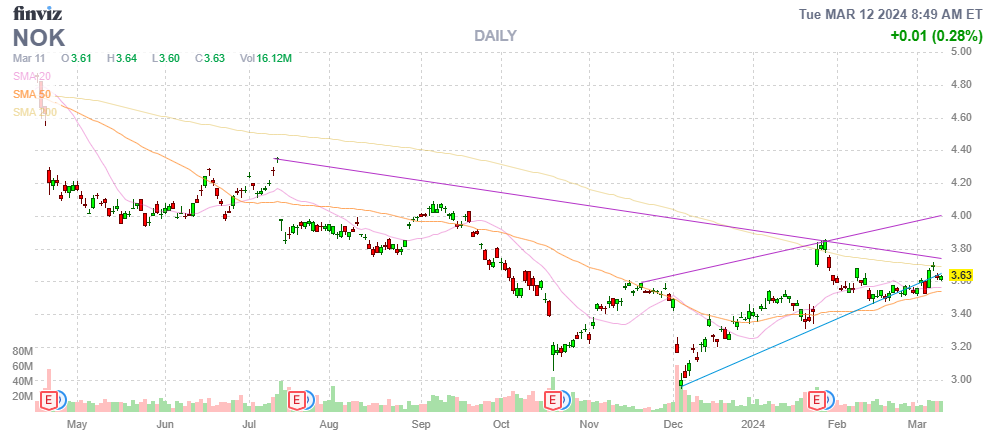
- NOK – They are actually coming back quite nicely.
-
- NYCB – We bought them for $5.11 and now $3.25 but our loss is small as we sold the $5 calls. That’s why I like those nice, conservative plays! $5 is still our 2026 target and our net entry is $2.71 so we’ll let it ride for now.
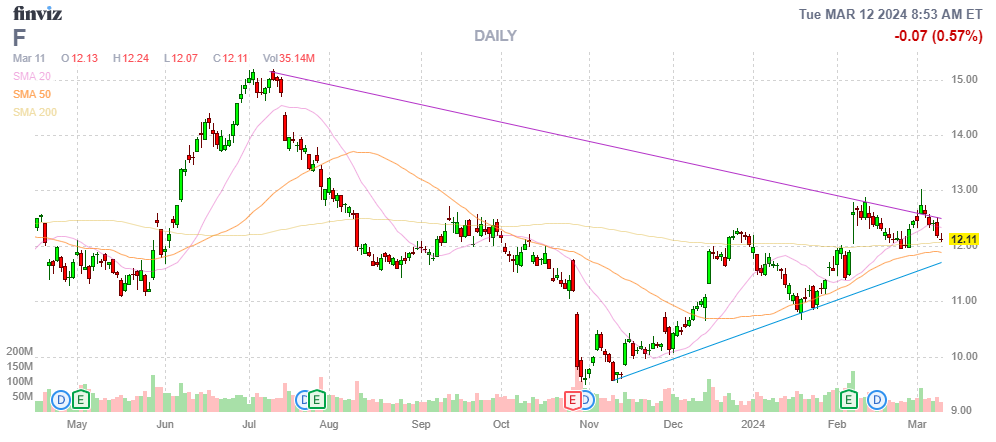
- F – They paid a special dividend and screwed up all the option pricing but we’re still on track.
-
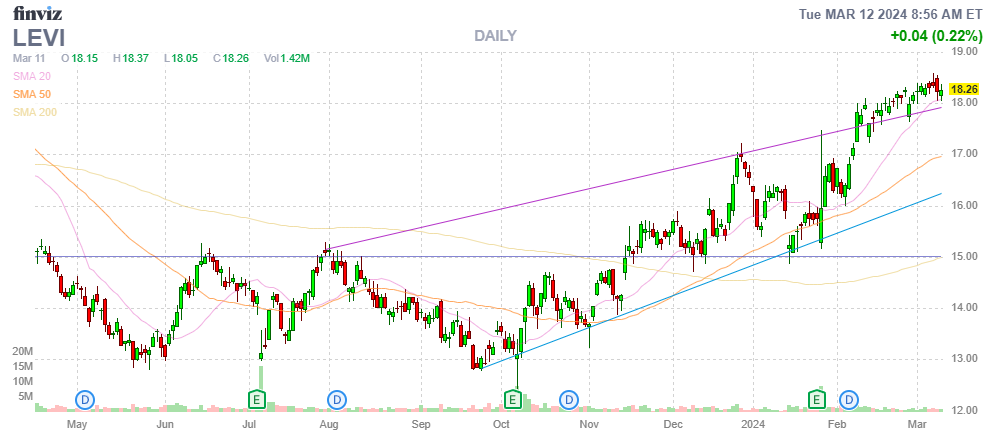
- LEVI – On track and still only net $2,187 on the $4,000 spread that’s $3,130 in the money so there’s $1,813 (82%) left to gain over the next 21 months – not bad!
-
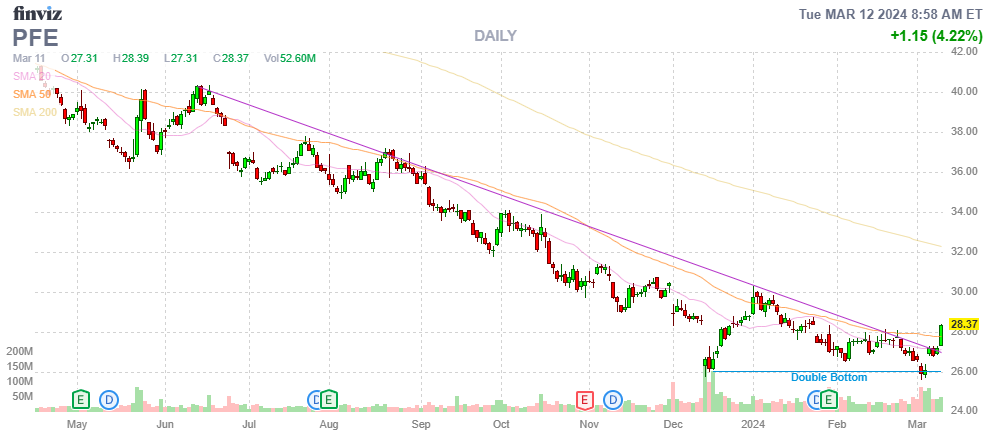
- PFE – Still unloved but got a nice pop yesterday. This is a $2,500 spread at net $720 so there’s $1,780 of upside potential at $35 – but it’s pretty far way from where we are at the moment. I still like it but not enough to double down (tempting though it may be).
-
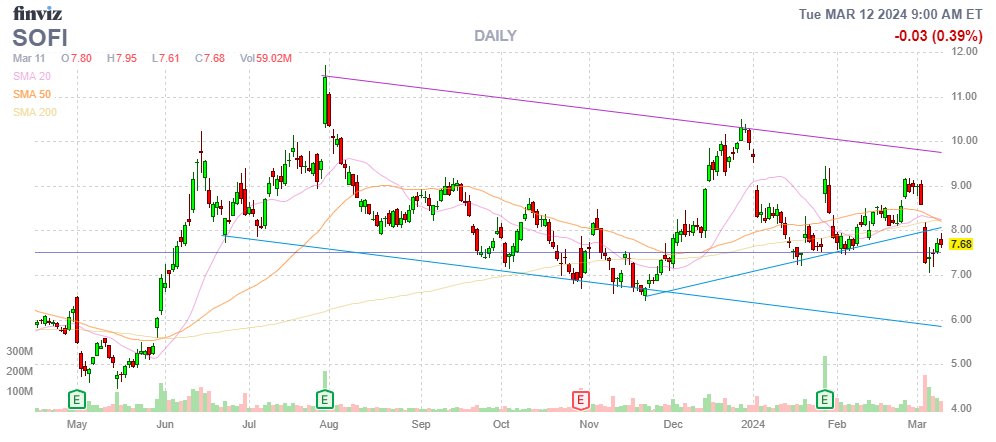
- SOFI – A bit low in our range but plenty of time to go. Still just net $1,100 on the $3,500 spread with $2,400 (218%) upside potential at $12.
-
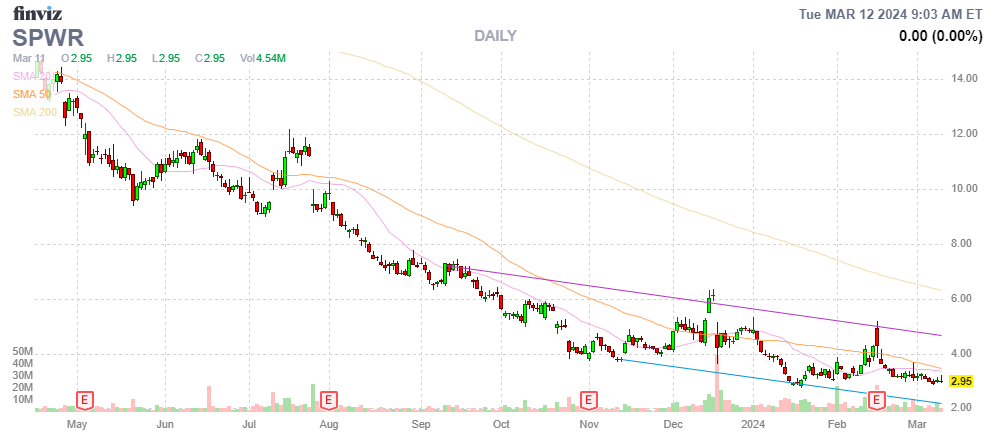
- SPWR – The entire solar industry is getting killed over cheap Chinese imports. Fortunately, with our cover, the loss is not too bad and that brief pop on last earnings was encouraging (but not sustained). We’ll leave it for now.
-
- TROX – On track.
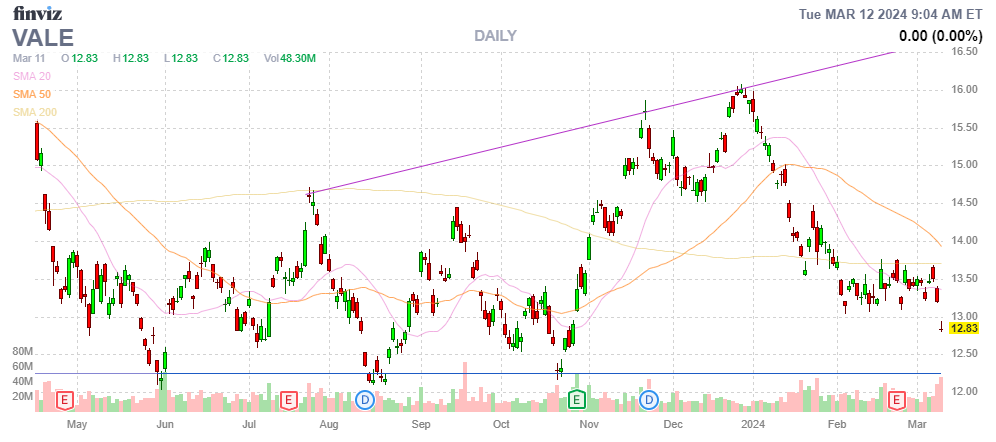
- VALE – Going the wrong way so far but they are a bouncy stock and we are patient people.
-
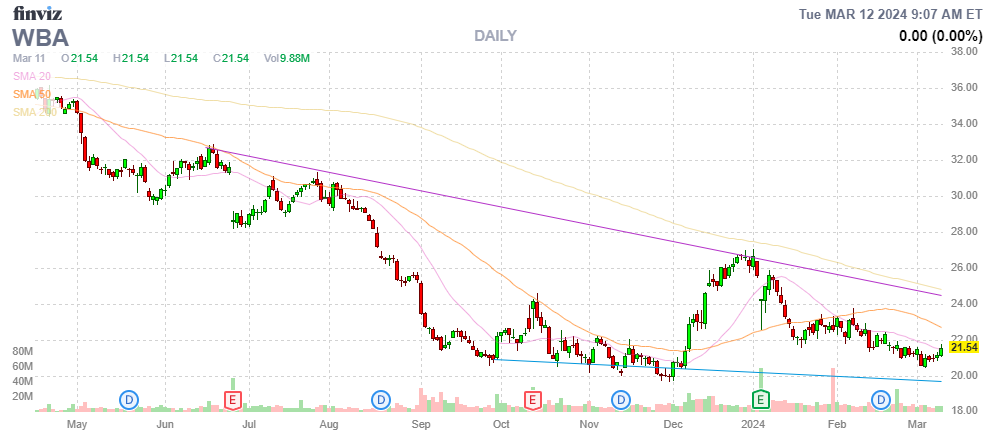
- WBA – We finally have a new CEO and I’m excited to see where things go.
-
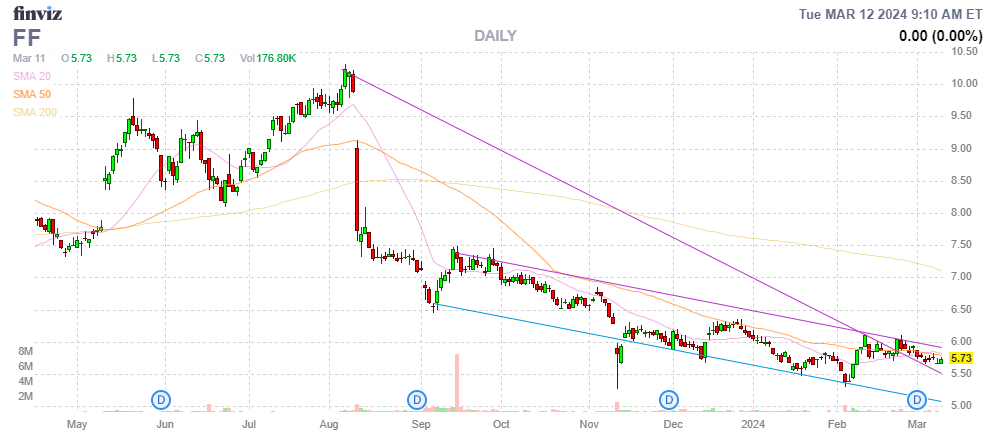
- FF – They just paid us an 0.06 ($60) dividend on March 1st and we’re over our target so let’s double down with 100 more shares at $5.73 ($573) as we’ll have to 2x roll those short calls anyway.
-
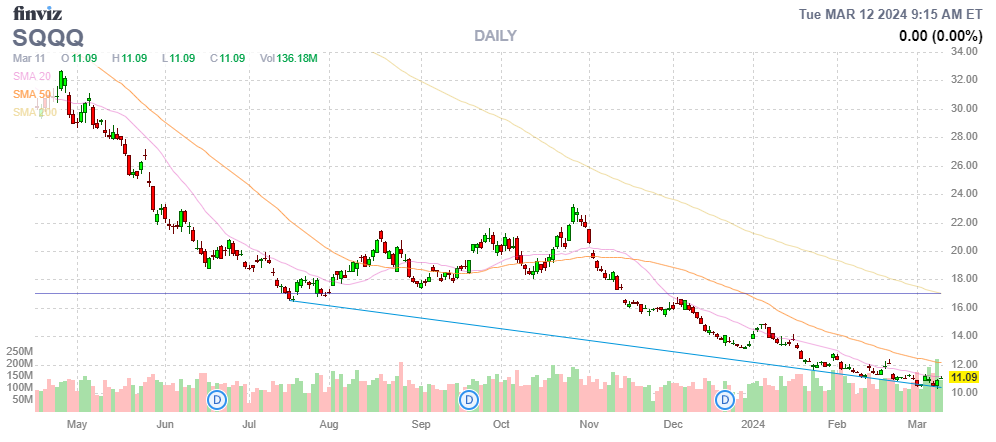
- SQQQ – Our hedge is down $569 but is it adequately protecting us? Well, SQQQ is a 3x inverse ETF on the Nasdaq so a 20% drop in the Nasdaq should bring SQQQ up 60% – to $17.75 and that would put us $7.75 in the money at $7,750 on our long calls and the short calls would still be out of the money so net $7,750 vs the current net of $1,936 means we have $5,564 of downside protection and I fee comfortable with that for now.
So we’ve spent $573 making just one adjustment and that leaves us with $3,751 left to deploy.
-
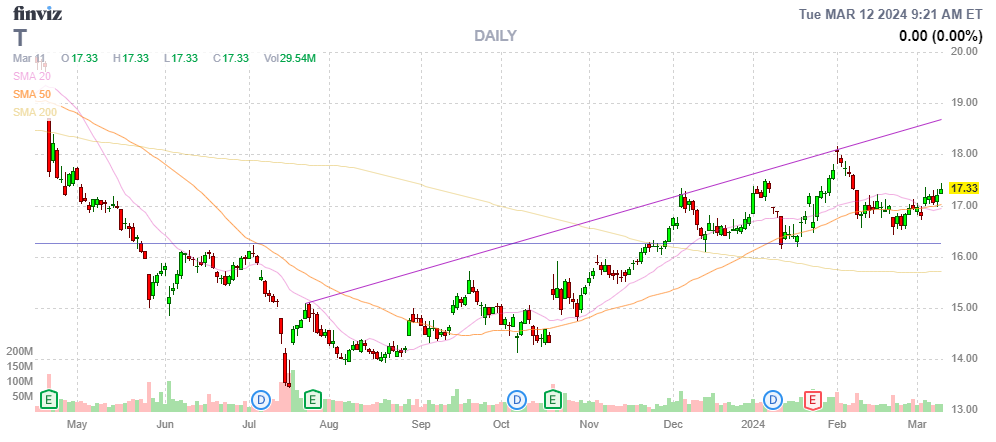
- I have to go with T as it’s still $17.33 which is $124Bn and they should make $16Bn this year AFTER debt service and that’s 7.75x – which is just silly! They paid 0.28 on Jan 9th and we could own the stock for net $15 selling the $17 calls and make about $4 over 2 years is a respectable 26.66% but I think we are better off with:
-
-
- Buy 10 T 2026 $15 calls for $3.25 ($3,250)
- Sell 10 T 2026 $20 calls for $1.05 ($1,050)
-
That’s net $2,200 on the $5,000 spread that’s $2,330 in the money to start so we capture every penny of a move up from here (capped at $20) but we lay out just $2,200 instead of $17,330 – Aren’t options fun?
That leaves us with $1,551 left to deploy with another $700 coming in next month so we’ll leave things there and see what develops.
8:30 Update: As we expected yesterday, CPI came in hot, Hot, HOT at 0.4% but, if you strip out Food and Energy – CPI was still 0.4%! Small Business Optimism was less so in Feb at 89.4, down from 89.9 in Jan.
We’re not getting much of a pre-market pullback but the Dollar is back to 103.08 and that will pressure everything else lower and this kind of inflation reading is not encouraging if you were hoping the Fed was about to lower rates – we are going the opposite direction for that!

 of the S&P 500 Worth $21.5Tn Are Reporting!")


