


The “perfect” breakout you just spotted on your screen is likely nothing more than a carefully laid trap designed to harvest your liquidity. It sounds cynical, but in the high stakes environment of 2026, the retail herd is often the last to know when a move is real. Mastering the art of identifying market trends isn’t about finding a secret formula; it’s about recognizing the footprints of institutional giants before they crush you. Most traders spend their days chasing ghosts, blinded by conflicting indicators and the constant hum of social media noise.
You’ve probably felt that sting of buying a top right before the floor falls out, or sitting on your hands while a massive move leaves you in the dust. It’s an exhausting cycle that erodes both your capital and your confidence. This article changes the narrative by teaching you how to distinguish between fleeting volatility and sustainable trends. We’ll provide a clear framework for your entry and exit points, helping you align your positions with the “Smart Money” rather than fighting against it. We’re moving from high level macro drivers to granular technical analysis, giving you the tools to hold through pullbacks and trade with the quiet conviction of a pro.
Key Takeaways
- Learn to categorize price movement into uptrends, downtrends, or consolidation phases to establish a solid baseline for every trade you consider.
- Understand how central bank policy and interest rates act as the primary gravity for long-term market direction, helping you stay on the right side of the tape.
- Master the technical footprints for identifying market trends, using price action and volume to spot where institutional money is actually moving in 2026.
- Identify the red flags of trend exhaustion and distribution so you don’t get caught buying at the top when the retail herd is most bullish.
- Leverage real-time professional commentary to filter out daily noise and build the confidence to hold your positions through minor market pullbacks.
Beyond the Basics: What Market Trends Actually Represent
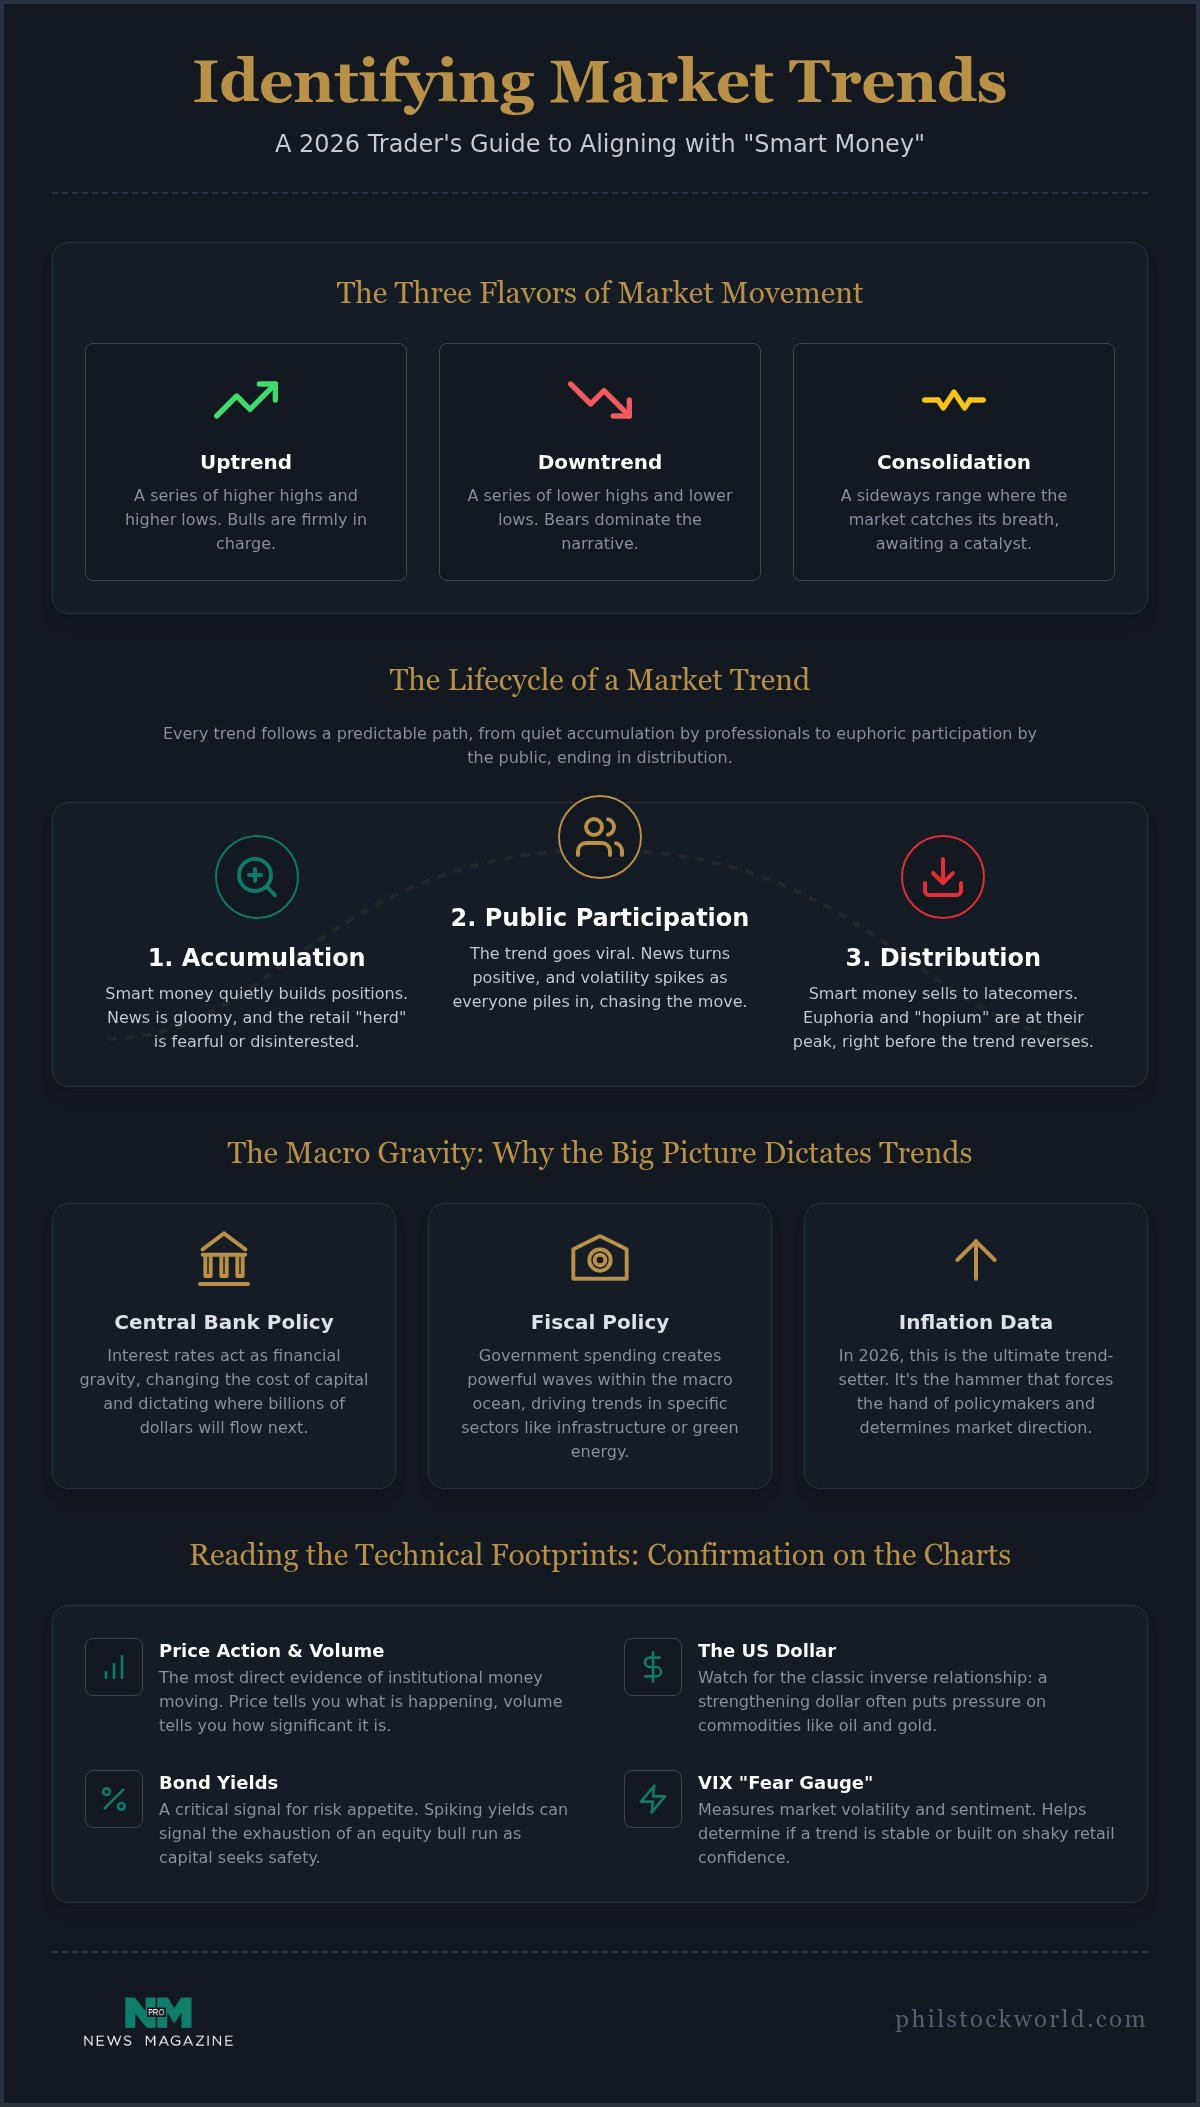
A Market trend isn’t just a colorful line moving across your trading screen; it’s the physical manifestation of collective human psychology and institutional intent. At its core, a trend represents the sustained direction of price over a specific timeframe. You’ll generally see these movements in three distinct flavors: uptrends where bulls are firmly in charge, downtrends where bears dominate the narrative, and sideways consolidation where the market is catching its breath and waiting for a fresh catalyst.
In 2026, the game has shifted significantly. Identifying market trends now requires you to look past the flashing green and red candles. The “House” (professional money) moves based on macro positioning and deep liquidity needs long before the “Herd” (retail traders) even gets a notification on their phone. If you’re waiting for a trend to look obvious on a 5 minute chart, you’re already too late. You’ve become the exit liquidity. Professionals don’t care about the “what” as much as the “why.” They look for the underlying imbalance that forces price to move in a specific direction.
The Three Timeframes of a Trend
Think of the market like an ocean. Primary trends are the tides. They last years and are driven by massive shifts in global policy, demographics, or technology. Secondary trends are the waves; these intermediate moves last weeks or months and often trick inexperienced traders into thinking the tide has turned. Then you have minor trends, the ripples. These are the short term noise and intraday volatility that retail traders obsess over while the pros ignore them entirely. If you don’t know which timeframe you’re trading, you’re just gambling on noise.
The Lifecycle of a Market Trend
Every trend follows a predictable, if brutal, path. It starts with the accumulation phase. This is where the smart money quietly builds positions while the news is still gloomy and the herd is fearful. Next comes the public participation phase. This is when the trend goes viral, the news turns positive, and volatility spikes as everyone piles in. Finally, we hit the distribution phase. This is vital for identifying market trends that are nearing their end. The pros start unloading their shares to the latecomers who are still high on “hopium,” right before the trend reverses and the cycle begins again. To protect your portfolio during these shifts, Alpha Shield provides specialized market signals to help navigate volatility and avoid significant drawdowns.
If you want to get serious about identifying market trends, you have to stop looking at individual stocks as isolated islands. They’re actually small boats on a very large, very volatile ocean. Central bank policy and interest rates act as the gravity for the entire financial system. When the Fed or global central banks shift their stance in 2026, they change the cost of capital, which dictates where billions of dollars will flow next. High rates act like a vacuum, sucking liquidity out of speculative assets, while low rates act like a floodlight, illuminating opportunities in growth sectors.
Fiscal policy and government spending create the specific waves within that macro ocean. If the government decides to dump billions into infrastructure or green energy, those sectors will trend regardless of what the broader S&P 500 is doing. In the 2026 economy, inflation data has become the ultimate trend-setter. It’s the hammer that forces the hand of policymakers. If you aren’t watching the “Big Picture” macro data before you open a chart, you’re essentially flying blind into a storm. You need to see the storm front before you worry about the individual waves.
Intermarket Relationships
Smart money doesn’t just watch one ticker. They watch the connective tissue of the global markets. There’s a classic inverse relationship between the US Dollar and commodities; when the greenback strengthens, oil and gold usually take a hit. Bond yields are another critical signal. If yields start spiking, it often signals the exhaustion of an equity bull run as capital seeks the safety of fixed income. We also keep a close eye on the VIX, or the “fear gauge,” to determine if a trend has actual stability or if it’s built on a foundation of shaky retail sentiment.
Sector Rotation: Following the Money
Capital rarely leaves the market entirely. It simply migrates. Sector rotation is the strategic migration of capital between industry groups based on the economic cycle. When the economy heats up, money might flood into tech and consumer discretionary. When things cool down, it hides in staples and utilities. Identifying the early signs of a shift from growth to value is how you stay ahead of the herd. Using professional Market Charts and Analysis can help you visualize these rotations before they become mainstream news, allowing you to position your portfolio where the money is going, not where it has been.
Technical Footprints: Reading the Charts for Confirmation
While macro drivers provide the “why” behind a move, technical analysis provides the “when.” Think of price action as the physical footprint left behind by institutional money. If you want to get good at identifying market trends, you have to look for the structural evidence of a move. In a bullish environment, this means a consistent pattern of higher highs and higher lows. It sounds simple, but retail traders often ignore this basic geometry in favor of complex, proprietary algorithms that offer little more than digital noise. Simple trendlines are often your best friend because they represent the psychological boundaries where the big players are willing to step in.
Volume is the ultimate lie detector in the 2026 market. A price move without significant volume is just a head-fake; it’s the market testing the waters without any real commitment from the “House.” When you see a breakout accompanied by a massive spike in volume, it suggests that the trend has actual legs. For a deeper dive into these visual cues, you should check out our guide on How to Read Market Charts to see how we filter out the daily ripples from the meaningful waves.
Key Technical Indicators for Trend Spotting
Don’t fall into the trap of “analysis paralysis” by layering twenty different indicators on your screen. Stick to the heavy hitters. We focus on Moving Averages, specifically the 50-day and 200-day. When the 50-day crosses above the 200-day, you’ve found the “Golden Cross,” a classic signal that the long term tide has turned bullish. We use the RSI (Relative Strength Index) to spot when a trend is becoming overextended and due for a pullback. Meanwhile, the MACD helps us gauge momentum shifts, showing us if the current move is accelerating or starting to lose its punch.
Support and Resistance: The Trend’s Boundaries
Every trend operates within a floor and a ceiling. Support is the level where buyers historically step in to prevent further drops, while resistance is where sellers typically unload their positions. The real skill lies in breakout trading. You need to distinguish a legitimate break from a “bull trap,” which is a fake move designed to suck in retail buyers right before a reversal. Smart traders don’t just guess at these levels. They use advanced option trading strategies to hedge their bets and profit from these boundaries without needing to be right 100% of the time.
Sentiment and the Herd Mentality: Identifying Trend Exhaustion
The most dangerous moment for your capital is when everyone around you seems to be making easy money. By the time a stock becomes a trending topic on social media or a headline on a major financial news network in 2026, the real opportunity has likely passed. Identifying market trends requires a healthy dose of skepticism toward the crowd. When the “herd” is at its most bullish, the “House” is usually busy preparing the exit. This is the distribution phase we touched on earlier, where institutional players quietly offload their positions to enthusiastic latecomers who are destined to become “bag holders.”
One of the most reliable, albeit unscientific, signals of trend exhaustion is the “Magazine Cover” indicator. When a specific sector or asset class finally makes it to the cover of a mainstream publication as the “next big thing,” the trend is almost certainly overextended. Mainstream media is a lagging indicator. It reflects what has already happened, not what is about to happen. To stay ahead, you must learn to look for the divergence between public excitement and actual market mechanics. Sentiment analysis helps you spot these cracks before they turn into a full blown collapse.
Institutional vs. Retail Sentiment
Professional money leaves a different trail than retail speculation. We look at the Put/Call Ratio to gauge the level of fear or greed currently baked into the price. A very low ratio suggests extreme complacency, which often precedes a “blow-off top” where price spikes vertically on pure emotion before crashing. Conversely, “panic bottoms” occur when the ratio spikes, signaling that the herd has finally given up. By comparing the “Smart Money” flow with retail option buying patterns, you can see if the big players are hedging their bets while the public is doubling down on a dying trend.
Psychology of the Disciplined Trader
Success in 2026 isn’t just about having the right data; it’s about having the right mindset. Overcoming FOMO (Fear of Missing Out) is the hardest part of identifying market trends. When a stock is going parabolic, your brain screams at you to jump in, but the disciplined trader knows that’s exactly when the risk-to-reward ratio is at its worst. The “House” stays calm because they have a plan that doesn’t rely on chasing green candles. If you find yourself making emotional trades based on headlines, it’s time for a virtual portfolio review to audit your strategy and strip the ego out of your decision making process.
Don’t let the herd’s panic dictate your financial future. Join our Premium Membership to gain access to real-time sentiment analysis and professional commentary that keeps you on the right side of the trade.
Joining the Trend: Using Phil Stock World to Trade Like the House
Identifying market trends in isolation is a recipe for second-guessing and missed opportunities. In the high-velocity environment of 2026, the signal-to-noise ratio is at an all-time low. You’re bombarded with conflicting data, “breaking” news that’s already stale, and social media influencers chasing the latest shiny object. Phil Stock World exists to cut through that static. We don’t just give you a list of tickers; we provide the macro context and real-time validation you need to act with conviction. It’s the difference between gambling on a hunch and executing a professional strategy.
By joining our community, you move from the retail herd to the “House” side of the table. We focus on a systematic, disciplined approach that prioritizes capital preservation and high-probability setups. You’ll learn to stop chasing every green candle and start waiting for the setups that actually align with institutional money flows. This isn’t about getting lucky; it’s about being prepared. Our goal is to transform the way you see the tape, moving you away from reactive guessing toward a proactive, house-centric mindset.
Real-Time Trend Alerts and Analysis
Timing is everything when you are identifying market trends. Our members receive notifications of major macro shifts often before they hit the mainstream headlines, allowing for early positioning. In our interactive trading sessions, you can watch veteran pros interpret complex chart patterns and macro data in real time. This isn’t a dry lecture. It’s a spirited, high-level discussion where we validate trends together. You get access to daily market charts and sector-specific insights that help you see the “Big Picture” we’ve discussed throughout this article, ensuring you never trade in a vacuum.
Educational Resources for Continuous Mastery
The market never stops evolving, and neither should you. We offer a suite of trading webinars for investors designed to sharpen your technical analysis skills and keep you ahead of the curve. Whether you’re refining your understanding of the “Golden Cross” or learning to spot the subtle signs of distribution, our resources are built for traders who value depth over hype. A Phil Stock World membership provides that elusive “insider” edge by connecting you with a community of like-minded innovators. It’s time to stop trading against the house and start trading like it. Join a community that values strategy, transparency, and the pursuit of individual opportunity.
Master the Tape and Trade with Conviction
Mastering the art of identifying market trends requires you to step away from the flashing lights of retail hype and look at the structural forces moving the needle. You’ve seen how macro policy acts as gravity and how technical footprints reveal the true intent of the “Smart Money.” Success in 2026 isn’t about being first to every move; it’s about being right on the ones that matter. By aligning your strategy with institutional flows and maintaining the discipline to ignore the herd’s panic, you can finally stop reacting to the market and start anticipating it.
You don’t have to navigate these volatile waters alone. Gain the “insider” edge with access to Phil Davis’s daily market commentary, real-time trade alerts in our live trading rooms, and a comprehensive library of educational webinars designed to keep your skills sharp. It’s time to elevate your game and trade with the quiet confidence of a professional. The market is always moving, and with the right framework, you’ll be ready for the next wave.
Stop following the herd and start trading like “The House”, join Phil Stock World today.
Frequently Asked Questions
What is the most reliable indicator for identifying market trends?
Price action supported by volume remains the gold standard for identifying market trends in 2026. While technical indicators like moving averages are helpful, they are lagging by nature. Price tells you what the market is doing right now, while volume reveals if the “House” is actually participating in the move. A price breakout without a significant volume spike is often just a head-fake designed to trap retail liquidity before a reversal.
How can I tell the difference between a trend reversal and a minor correction?
Distinguishing between the two requires looking at market structure and volume patterns. A minor correction typically stays within the boundaries of previous support and occurs on relatively lower volume. A true reversal often starts with a “blow-off top” followed by a failure to make a new high. When you see price break a major support level on heavy institutional volume, it’s a clear signal that the trend has likely ended.
Is trend following still a viable strategy in the high-frequency trading era of 2026?
Trend following is absolutely viable because algorithms can’t fight macro-economic gravity forever. High-frequency trading creates a lot of intraday “ripples” and noise, but it doesn’t change the primary tide dictated by central bank policy and inflation data. The key for a savvy trader is to zoom out. By focusing on primary trends rather than millisecond fluctuations, you can align your capital with the sustained movements that the pros follow.
How much historical data do I need to accurately identify a primary trend?
You generally need at least six to twelve months of price data to confirm a primary trend. In the 2026 market, it’s also wise to look back at three-to-five-year cycles to understand the broader macro context. While short-term data is great for entry timing, primary trends are the “tides” of the market. They are built on long-term shifts in interest rates and fiscal policy that don’t reveal themselves in a few weeks.
Can I identify market trends using only fundamental analysis?
Fundamental analysis is excellent for understanding the “why” behind a move, but it often fails at the “when.” You might be right about a sector’s growth potential, but the market can remain irrational longer than you can stay solvent. To be successful, you must marry fundamental insights with technical confirmation. Using technicals allows you to see if the “Smart Money” agrees with your thesis before you commit your own hard-earned capital.
What is the “Golden Cross” and why do traders watch it?
The Golden Cross occurs when a short-term moving average, usually the 50-day, crosses above a long-term moving average, like the 200-day. Traders watch this because it’s a powerful signal that long-term momentum has shifted from bearish to bullish. It often marks the transition from the accumulation phase to the public participation phase. Because so many institutional algorithms watch this specific level, it frequently becomes a self-fulfilling prophecy that drives significant buying.
How does market sentiment affect the duration of a trend?
Sentiment acts as the fuel for a trend, but it also signals its eventual exhaustion. A trend can last a long time as long as there is “climbing a wall of worry.” However, when sentiment reaches an extreme bullish peak and everyone is in the trade, there’s no one left to buy. Identifying market trends that are nearing their end often involves spotting when sentiment has moved from rational optimism to pure mania.
Why do most retail traders fail to profit from clearly identified trends?
Most retail traders fail because they lack the discipline to hold through minor pullbacks or they enter far too late. They often wait for a trend to look “safe” before buying, which usually happens right at the top. Additionally, many get shaken out by short-term noise because they haven’t aligned their trades with the “House” perspective. Without a systematic framework for entries and exits, even a perfectly identified trend won’t lead to profit. Traders who participate in interactive trading sessions alongside seasoned mentors often develop the discipline and real-time pattern recognition needed to overcome these common pitfalls.

