


The death of the Pattern Day Trader rule in June 2026 didn’t just open the floodgates for retail traders; it handed you a loaded gun that most people don’t know how to aim. While the new intraday margin framework offers unprecedented freedom, it also means you’re swimming in deeper, more volatile waters where the old rules of engagement have shifted. You’ve likely felt the sting of getting stopped out by a random wick just minutes before a move goes your way, or felt that familiar itch of FOMO during a vertical rally. Understanding how to navigate bullish and bearish trade setups in this high-speed environment isn’t just about reading a chart; it’s about knowing which signals are the real deal and which are just bait for the “herd.”
We’ve all stared at conflicting indicators, wondering if the macro news is about to blow up our technical analysis. In this article, you’ll learn a repeatable framework to identify high-probability trade setups that align with professional risk management and the broader market pulse. We’ll strip away the noise and show you how to execute trades with the confidence of someone who understands the “house” perspective. We’ll dive into the technical triggers that matter, the macro filters you need, and the portfolio management tactics that keep you in the game when the market gets moody.
Key Takeaways
- Learn to filter out technical noise by identifying the specific, repeatable conditions that transform a random chart pattern into a high-probability trade.
- Master the mechanics of bullish and bearish trade setups, from spotting “Buy the Dip” support levels to profiting from cascading “Bear Flag” drops.
- Adopt the “House Perspective” by using advanced option strategies that generate income and provide a safety net if the market moves sideways.
- Bridge the gap between analysis and execution with a disciplined five-step workflow designed to keep your emotions in check.
- Gain the confidence to pull the trigger by validating your setups within a community of savvy, like-minded traders.
The Anatomy of High-Probability Bullish and Bearish Trade Setups
A trade setup isn’t a hunch or a “feeling” about where a stock might go next. It’s a specific, repeatable set of conditions that historical data and current logic suggest will lead to a high-probability outcome. In the 2026 market, where intraday volatility has shifted following new margin regulations, distinguishing between technical noise and actionable signals is the difference between a growing portfolio and a blown-out account. Professional bullish and bearish trade setups aren’t just lines on a screen; they’re strategic battle plans that account for the prevailing market trend, ensuring you aren’t fighting the tide with your capital.
Most indicators you see on social media are just noise designed to keep you clicking. A real signal only emerges when multiple factors align. Think of market sentiment as the wind at a trader’s back. If the wind is blowing against you, even the “perfect” chart pattern will struggle to make headway. We look for setups where the path of least resistance is clearly defined by the players who actually move the needle.
Why Technical Patterns Fail Without Macro Context
Charts tell you where price has been, but they don’t always tell you where it’s going. Relying solely on a double bottom or a flag pattern is a rookie mistake because macro market insights often override whatever the candles are doing. The “herd” typically spots a “perfect” setup right as the institutional players are looking for liquidity to exit their positions. You’ve seen it happen: a breakout looks flawless, retail traders pile in, and then the rug gets pulled. A high-probability setup is one where technical triggers, fundamental strength, and overall market sentiment converge into a single direction.
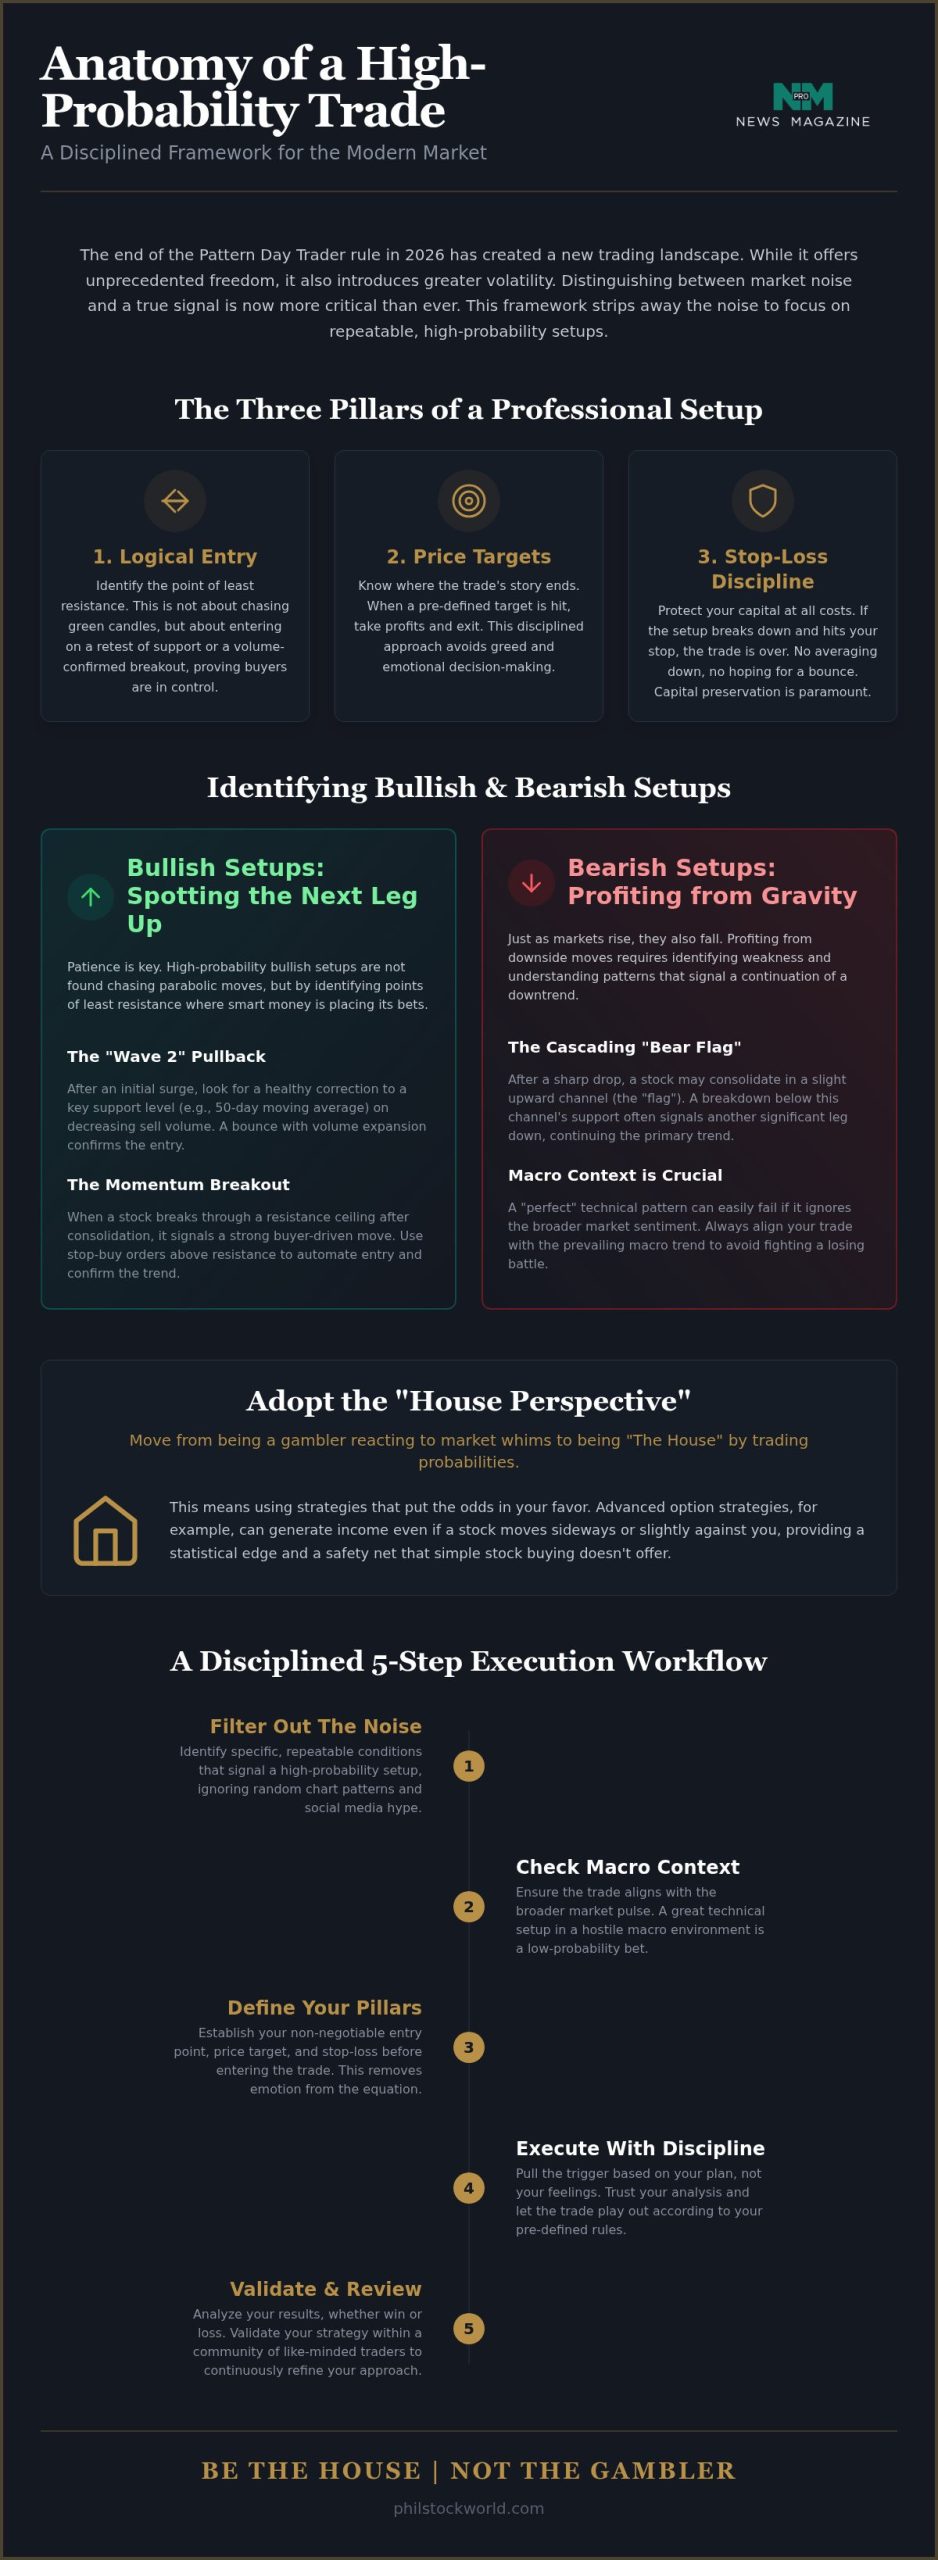
The Three Pillars of a Professional Setup
Every trade you take needs a structure that removes the need for mid-trade guesswork. Professional traders build their bullish and bearish trade setups around three non-negotiable pillars:
- Logical Entry: This isn’t about chasing a green candle. It’s identifying the exact point of least resistance, usually a retest of a known support level or a confirmed volume breakout that proves buyers are in control.
- Price Targets: You need to know when the “story” of the trade has ended. When your target is hit, you take your profits and walk away, regardless of how much higher the “moon” might be.
- Stop-Loss Discipline: Protecting your capital is the only way to stay in the game. If the setup breaks down and hits your stop, the trade is over. We don’t “average down” or hope for a bounce that isn’t coming.
By treating these pillars as law, you move from being a gambler to being the “house.” You aren’t trying to predict the future; you’re simply trading the probabilities that the market provides.
Bullish Trade Setups: Spotting the Next Leg Up
Chasing a parabolic move is the fastest way to become exit liquidity for institutional players. In a market where the “herd” is often blinded by green candles, the savvy trader waits for the noise to settle. High-probability bullish and bearish trade setups are built on patience and the recognition of where the smart money is actually placing its bets. In a bullish environment, your goal isn’t just to be “long”; it’s to be long at the point of least resistance, where the probability of a move higher far outweighs the risk of a reversal.
The Pullback: Trading the “Wave 2” Correction
Markets don’t move in straight lines. They breathe. After an initial surge, a healthy correction often brings price back to a dynamic support level, such as the 50-day or 200-day moving average. We look for “Wave 2” to complete with a decrease in selling volume, signaling that the supply is exhausted. The difference between a dip and a trend reversal is found in the subsequent bounce. If price recovers with volume expansion, you have a confirmed entry. If it limps back up on low volume, the “dip” might just be a trap for the unwary.
The Momentum Breakout: Riding the Trend
Breakouts occur when a stock finally punches through a ceiling of resistance after a period of consolidation. Whether it’s a rectangle or a triangle pattern, these zones represent a battle between buyers and sellers. Instead of trying to time the exact moment of the break, use stop-buy orders placed slightly above the resistance line. This automates your entry and ensures you only buy when the momentum is truly behind you. Chasing a breakout that has already moved 5% or 10% away from the pivot point is a cardinal sin; at that point, you’re buying at the top of the range.
For those who prefer a more structured approach to growth, the Bull Flag remains a gold standard for continuation. It’s a tight, orderly consolidation that suggests the primary uptrend is simply taking a break before the next leg higher. While riding these waves, you can enhance your returns by looking into covered call trading ideas to boost your yield while the stock works through its pattern. If you want to see how we filter these setups in real-time, checking out our latest Market Charts and Analysis can help you stay ahead of the next big move.
Bearish Trade Setups: Profiting from Market Gravity
They say the bulls take the stairs while the bears jump out the window. It’s an old cliché because it’s true; bearish moves are often faster, more violent, and fueled by a raw emotion that bullish runs lack: fear. While your average investor panics when the red candles start stacking, a savvy trader sees opportunity. Mastering bullish and bearish trade setups means understanding that market gravity is a powerful force. When the buying pressure evaporates, the vacuum left behind can lead to cascading drops that offer significant profit potential if you know how to position yourself.
The classic trend reversal signal remains the “Head and Shoulders” pattern. It’s a visual representation of a market that tried to reach a new high, failed, and is now rolling over. Similarly, the “Double Top” acts as a clear sign of exhausted buying pressure at a specific resistance level. Instead of guessing where the top is, we look for these structural failures to confirm that the “smart money” has already left the building and the path of least resistance is now down.
The Reversal: When the Bull Market Tires
Spotting a top before it happens is a high-stakes game, but it’s also where many traders lose their shirts by being too early. We use divergent indicators, like the RSI or MACD, to see if the price is making new highs while momentum is actually fading. This bearish divergence is a major red flag. However, confirmation is everything. Waiting for a lower low to be established is much safer than trying to “call the top” in a parabolic market. Bearish breakdowns are notoriously volatile, so keeping your position size manageable is crucial when the floor starts to give way.
The Bear Flag: Trading the Continuation
When a market is in a freefall, it rarely drops in a straight line. It pauses, forms a small, upward-sloping consolidation, and then continues its descent. This is the “Bear Flag.” You can project potential price targets by measuring the “pole” of the flag and applying that same distance to the breakdown point. Panic accelerates these bullish and bearish trade setups, often causing the second leg of the drop to be even more aggressive than the first as late-to-the-party bulls finally capitulate.
Pure shorting can be a dangerous game with unlimited risk and the constant threat of a “short squeeze.” A smarter way to play the downside is hedging with put options, which provides portfolio protection without the same margin requirements. It allows you to profit from market gravity while defining your maximum risk from the moment you enter the trade.
The House Perspective: Adding Probability to Your Setups
Most retail traders treat the market like a casino, placing big bets on directional moves and hoping for a jackpot. Professional traders, or “The House,” operate differently. They don’t just look for bullish and bearish trade setups; they look for ways to stack the odds in their favor so they can profit even if their timing isn’t perfect. By shifting from an options buyer to an options seller, you move from being the gambler to being the one who owns the tables. This approach prioritizes consistency over the occasional “home run” that usually comes with a high price tag of failed attempts.
Selling Premium: The Ultimate Probability Booster
Buying a call or a put requires the market to move in your direction, by a certain amount, within a specific timeframe. That’s a lot of things that have to go right. Selling premium through credit spreads allows you to turn a directional setup into a high-probability income trade. This is the “Be the House” philosophy in action, where you profit from time decay (Theta) rather than fighting it. Selling a put spread can be a bullish setup with a built-in margin for error, allowing the stock to stay flat or even drop slightly while you still walk away with a profit.
To truly master this, you need to implement advanced option trading strategies that go beyond simple directional bets. It’s about creating a structure where time is your ally, not your enemy. When you sell volatility instead of buying it, you stop praying for a miracle and start collecting rent on your positions.
The Virtual Portfolio Review: Auditing Your Setups
Finding a setup is easy; managing it is the hard part. Integrating risk management for options into every technical setup is what prevents a single bad week from wiping out months of gains. No single setup should ever have the power to break your portfolio. Proper position sizing ensures that you can survive the inevitable string of losses that comes with any trading career. We use a virtual portfolio review to track real-world performance against chart theory, which helps identify the personal biases that lead to “false positive” setups.
Reviewing your past setups is often more valuable than hunting for new ones. It reveals whether you’re actually following your rules or if you’re letting FOMO drive your decisions. If you’re ready to stop guessing and start trading with a documented edge, consider a virtual portfolio review to audit your strategy and align your trades with the 2026 market pulse.
Executing Your Strategy: From Chart Pattern to Virtual Portfolio
A professional workflow ensures that you never enter a trade on a whim. Use this checklist to filter out the noise and focus on high-probability opportunities where the technicals and macro trends align:
- Step 1: Identify the Macro Trend: Determine if the overall market is Bullish, Bearish, or Neutral. Don’t waste energy swimming against the tide.
- Step 2: Locate the Technical Setup: Look for a confirmed pattern, like those discussed in previous sections, combined with volume confirmation to prove institutional interest.
- Step 3: Define the Risk/Reward Ratio: Aim for a minimum of 1:2. If you’re risking a dollar to make fifty cents, the math will eventually catch up with you.
- Step 4: Choose the Instrument: Decide whether a straight stock play or a specific options strategy, like a credit spread, offers the best “House” edge for the current volatility.
- Step 5: Log the Trade and Monitor: Record your entry, exit, and thesis. This data is what transforms a series of trades into a professional strategy.
Leveraging the Phil Stock World Community
Trading in a vacuum is a recipe for retail failure. When you’re alone with your screen, your biases start to look like facts. That’s why getting real-time feedback in a live trading room for options is a game-changer. It allows you to bounce your ideas off veteran analysts who have seen these patterns play out over decades. You aren’t just looking for someone to agree with you; you’re looking for someone to point out the blind spots you might have missed in your bullish and bearish trade setups.
A Phil Stock World membership gives you the “edge” needed to navigate the complexities of the modern market. It’s the difference between guessing and knowing. By sticking to a disciplined trading approach, you move away from chasing the latest hype and start building a portfolio based on systems, logic, and the relentless pursuit of probability. The market will always be volatile, but your execution doesn’t have to be.
Mastering the Market Pulse in 2026
The days of blindly following a chart pattern and hoping for the best are over. Success in the modern market requires a bridge between technical signals and macro reality. By refining your bullish and bearish trade setups with a “House” perspective, you stop being a victim of volatility and start using it to your advantage. Whether you’re riding a momentum breakout or hedging against a bearish reversal, the real edge comes from a disciplined, repeatable process and the support of a savvy community.
Since 2006, we’ve helped independent investors move beyond the herd. You don’t have to navigate these rapid market shifts alone. When you Join Phil Stock World and Trade Like “The House” Today, you get direct access to real-time interactive trading sessions, exclusive virtual portfolio reviews, and instant trade alerts. It’s time to stop guessing and start executing with the confidence of an insider. The market is moving; make sure you’re moving with it.
Frequently Asked Questions
What is the most reliable bullish trade setup for beginners?
The “Buy the Dip” setup is generally the most reliable for those just starting out. You look for a stock in a clear uptrend that pulls back to a major moving average, such as the 50-day line. This provides a clear area of support where you can define your risk. It’s much less stressful than chasing a vertical move that could reverse at any moment. This setup allows you to buy value within a strong trend rather than overpaying for hype.
How do I distinguish between a bearish reversal and a temporary pullback?
Confirmation is the key to telling the difference. A temporary pullback usually happens on lower volume and stays above established support levels. A bearish reversal is marked by a break of that support on heavy volume followed by a lower high. We use divergent indicators to see if momentum is dying while price is still climbing. If support fails, the “story” of the uptrend is over and it’s time to protect capital and move to the sidelines.
Can I trade bullish and bearish setups using only options?
Yes, and using options often provides a superior “House” edge. Instead of just buying a stock, you can use credit spreads to profit from time decay. This means your bullish and bearish trade setups can still make money even if the price stays relatively flat. It’s a sophisticated way to trade that prioritizes income and risk management over pure price speculation. Options give you more ways to win than just being right on a specific price direction.
What is the best time frame for identifying trade setups?
Most professional setups are identified on the daily chart to ensure they align with the broader macro trend. Once you find a high-probability pattern there, you can drop down to a 15-minute or 60-minute chart to fine-tune your entry point. Trading solely on one-minute charts often leads to overtrading and getting chopped up by technical noise. The daily chart is where the real institutional moves and long-term trends become visible to the savvy trader who values clarity.
How much capital should I risk on a single trade setup?
Never risk more than 1% to 2% of your total account equity on any single trade. This doesn’t mean your position size is small. It means your maximum loss if the stop-loss is hit shouldn’t exceed that percentage. This disciplined approach keeps you in the game during losing streaks. It turns trading into a business of probabilities rather than a series of high-stakes gambles that could break your virtual portfolio and your confidence along with it.
Is it better to buy a breakout or wait for a retest?
Waiting for a retest is generally the safer play for most independent investors. While you might occasionally miss a move that never looks back, the retest confirms that previous resistance has actually turned into new support. In the volatile 2026 market, many breakouts are just “bull traps” designed to grab retail liquidity. Letting the market prove itself first is a hallmark of a professional who values capital preservation over the excitement of the chase.
How do macro-economic events affect technical chart patterns?
Macro events act as the “wind” at the back of your technical patterns. A perfect bullish setup can be completely invalidated by an unexpected interest rate hike or a negative GDP report. We always check the economic calendar before pulling the trigger. If a major announcement is due, it’s often better to wait until the dust settles rather than gambling on the outcome of a news event that technical chart patterns simply can’t predict with accuracy.
What are the most common mistakes traders make when identifying setups?
The biggest blunders include chasing price due to FOMO and ignoring the underlying volume. A breakout on low volume is often a lie. Many traders also fail to have a predefined exit plan, leading to “hoping” a losing trade turns around. High-probability bullish and bearish trade setups require a logical entry, a clear target, and a hard stop-loss. Without those three pillars, you aren’t trading; you’re just guessing with your hard-earned money and hoping for luck.

