


Most retail traders treat their charts like a high-stakes Ouija board, hoping the next crossover will magically predict the future. The house doesn’t play that game. While the crowd is busy chasing lagging signals into a slaughterhouse, professional traders are busy pricing risk. If you’ve ever felt the paralysis of staring at twenty different oscillators only to watch your trade evaporate because you ignored volatility, you aren’t alone. It’s the classic herd experience, where you’re the one providing the liquidity for the people who actually know how to read the room. Finding the best indicators for options trading isn’t about finding a magic wand; it’s about building a mathematical edge that works even when the market gets weird.
We’re going to fix your dashboard by stripping away the fluff that clutters your screen and your mind. This guide promises to move you past the generic advice and into the mindset of a savvy insider who treats every trade like a business decision. You’ll discover how to leverage specific technical and volatility tools to price risk correctly and execute with data-backed confidence. We’ll explore a simplified set of indicators designed for the 2026 market, ensuring you’re no longer the prey, but the one holding the deck.
Key Takeaways
- Shift your mindset from chasing price to measuring probability, ensuring you don’t get trapped by standard “buy” signals that lead to losing option trades.
- Discover the best indicators for options trading in 2026, focusing on the “Holy Trinity” of momentum and volatility to identify when premiums are mispriced.
- Decode the Volatility Smile and the VIX to read market sentiment like an insider and stop being the liquidity for professional players.
- Build a simplified 2026 dashboard that cuts through the noise, using a clean setup of moving averages and momentum oscillators to execute trades with data-backed confidence.
- Learn why static indicators aren’t enough and how real-time collaboration can help you interpret market data with the speed and precision required for today’s volatility.
Beyond the Chart: Why Standard Indicators Fail Options Traders
Most retail traders treat their technical charts like a religious text, expecting a simple crossover to deliver guaranteed profits. If you’re using a standard Relative Strength Index (RSI) to time your call buys without looking at the underlying Greeks, you’re playing a game designed to take your money. Stock traders only care about direction, but options traders have to deal with the relentless erosion of time and the shifting sands of sentiment. Professional traders don’t look for certainty; they use indicators to measure probability and find where the market has mispriced risk.
A “buy” signal on a stock chart is often a trap for the unwary options buyer. You can be 100% right about the stock’s eventual direction and still watch your position expire worthless. This usually happens because you ignored implied volatility. If you buy a call when volatility is at a local peak, the subsequent “vol crush” can drain the option’s value faster than the rising stock price can replenish it. The house knows this. The herd doesn’t. While the herd is busy celebrating a chart breakout, the house is busy selling them overpriced insurance.
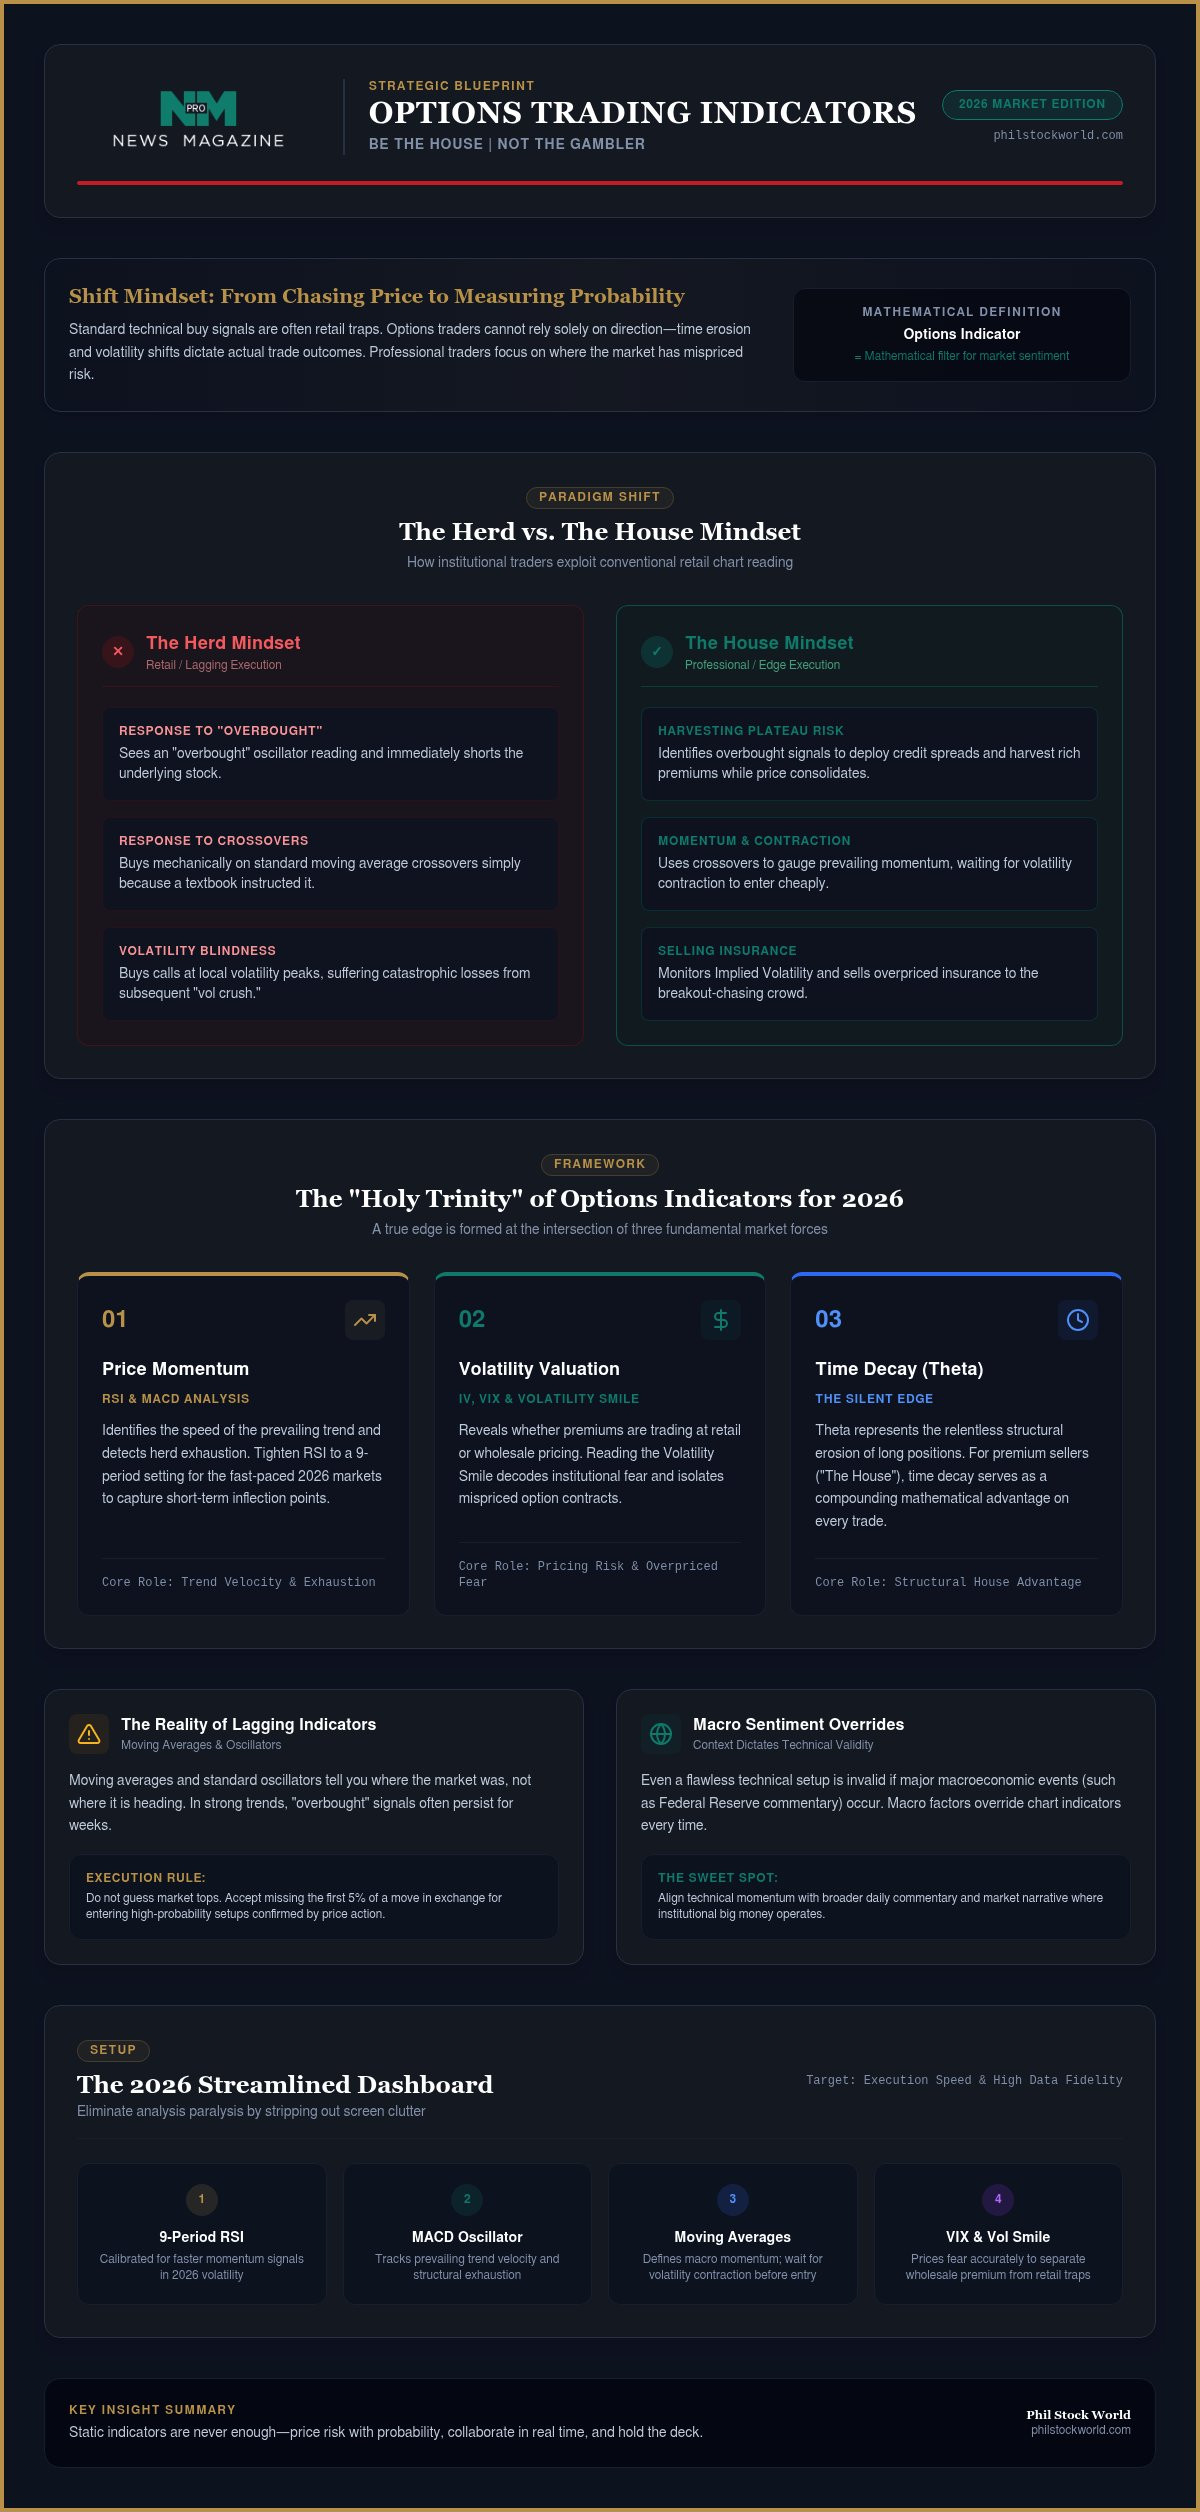
The herd misuses technical tools by treating them as absolute instructions rather than contextual clues. Here is how the perspectives differ:
- The Herd: Sees an “overbought” signal and immediately shorts the stock.
- The House: Sees an “overbought” signal and looks for credit spreads to harvest high premiums while the trend plateaus.
- The Herd: Buys on a moving average crossover because a textbook told them to.
- The House: Uses crossovers to identify the prevailing momentum and then waits for a volatility contraction to enter cheaply.
An options indicator is a mathematical filter for market sentiment.
The Problem with Lagging Indicators
Moving averages and most oscillators are inherently lagging; they tell you where the party was, not where it’s going. In a parabolic market, “overbought” signals often persist for weeks, leading stubborn contrarians into a series of painful losses. Professional traders use this lag to their advantage. Instead of guessing a top, they wait for price action to confirm the indicator’s signal. They don’t mind missing the first 5% of a move if it means they’re entering a high-probability setup with a defined edge.
Integrating Macro Sentiment with Technicals
A perfect technical setup is essentially useless if the Federal Reserve is scheduled to speak in twenty minutes. Macro events override the best indicators for options trading every single time. This is why you cannot trade in a vacuum. You need to understand the “why” behind the price action. I suggest you check the daily stock market commentary to get a handle on the broader narrative. When your technical indicators align with the macro sentiment, you’ve found the sweet spot where the big money operates.
The “Holy Trinity” of Options Indicators for 2026
Stop looking for a magic bullet. The best indicators for options trading aren’t found in a single line on a chart, but in the intersection of three distinct forces. We call this the Holy Trinity: Price Momentum, Volatility, and Time. If you only look at price, you’re just a stock trader with a more complicated tax return. To truly “Be the House,” you must understand how these components interact to create a mathematical edge. While the herd focuses on where the stock is going, the professional focuses on what the option is actually worth.
Price momentum tells you the speed of the trend, while volatility analysis tells you if you’re paying retail or wholesale for your position. Then there’s Theta, the silent killer of long positions. Theta isn’t just a number on your screen; it’s a structural advantage for those who sell premium. When you read these three factors together, you aren’t just guessing; you’re measuring the market’s pulse to see where it has overextended its own logic.
Price Momentum (RSI & MACD)
Relative Strength Index (RSI) is frequently misunderstood as a simple overbought or oversold signal. In reality, it’s a measure of herd exhaustion. When RSI hits extreme levels, it doesn’t mean the trend is over, but it does mean the “easy money” has been made and a reversal or plateau is imminent. For the fast-paced 2026 markets, we often suggest tightening your RSI to a 9-period setting for shorter-term plays to catch rotations before they become obvious. Moving Average Convergence Divergence (MACD) then acts as your confirmation. It filters out the noise, ensuring that you don’t jump into a momentum trade until the trend has actual structural support behind it.
The King of Options Indicators: IV Rank
This is the gap where most retail traders fall through the floor. Implied Volatility (IV) Rank is the single most important tool in your kit because it puts current volatility into a historical context. While IV tells you the market’s expectation of future movement, IV Rank tells you if that expectation is expensive or cheap relative to the last year of data. If the IV Rank is over 70, the options are priced for a catastrophe. Buying a call in that environment is a losing game because even if the stock goes up, a drop in volatility will crush your premium. The house waits for these high IV Rank moments to become the seller, collecting the “fear tax” from the herd. If your current strategy feels like it’s missing this layer of sophistication, a Virtual Portfolio Review can help you align your indicators with this institutional perspective.
Advanced Volatility Indicators: Spotting Overpriced Fear
If you want to move beyond the basics, you have to look at the “Volatility Smile.” This isn’t just some academic curve; it’s a map of where the crowd is panicking. Usually, out-of-the-money puts are priced higher than equivalent calls because the herd fears a crash more than they hope for a rally. When you see this smile get particularly steep, it’s a signal that the market is overpaying for protection. The house sees this lopsided pricing and steps in to sell that overpriced fear. It’s about recognizing when the “insurance” premiums have become disconnected from the actual statistical risk.
The VIX acts as your global thermometer. When the VIX is screaming higher, the cost of every option on the board inflates. For the retail herd, a high VIX is a reason to hide. For the professional, it’s a harvest season. High volatility environments allow you to sell credit spreads with wider margins of safety while still collecting significant juice. You’re effectively acting as the casino during a storm, charging a massive premium to anyone who wants to place a bet.
One of the most reliable ways to profit from these shifts is the “Volatility Crush.” This typically happens right after an earnings report. Leading up to the news, IV spikes as the market braces for impact. Once the numbers are out, the uncertainty vanishes, and the IV collapses regardless of which way the stock moves. By selling premium just before the announcement, you’re positioning yourself to profit from the rapid deflation of that uncertainty.
Bollinger Bands and Volatility Squeezes
Bollinger Bands are among the best indicators for options trading when you’re hunting for the calm before the storm. When the bands tighten into a “squeeze,” it tells you that volatility has reached a local floor and a massive expansion is imminent. The trick is timing the entry. Many traders fall for the “head fake,” where the price breaks one way only to reverse and rocket in the opposite direction. Professionals wait for volume confirmation to ensure the breakout has the institutional legs to sustain a long straddle or strangle play.
Standard Deviation and Probabilities
The house wins because it understands that the market follows a rough bell curve over time. A 1-standard deviation move covers approximately 68% of expected price outcomes. If you’re selling spreads outside that range, you’re playing the high-probability side of the coin. You can use professional stock market charts to visualize these probability cones and set your strikes where the math is in your favor. This isn’t gambling. It’s actuarial science applied to the ticker tape, ensuring you’re the one collecting the checks 70% of the time.
Avoiding Analysis Paralysis: Creating Your 2026 Trading Dashboard
If your trading screen looks like a neon spaghetti factory, you’ve already lost the battle. Many retail traders suffer from “indicator soup,” where they layer so many oscillators and overlays that their signals inevitably contradict each other. This leads to hesitation and missed opportunities. The house doesn’t trade on clutter. To find the best indicators for options trading, you need a streamlined workflow that moves from the broad trend down to the specific entry point. Your dashboard should be a tool for clarity, not a source of confusion.
Building a professional-grade dashboard in 2026 follows a logical five-step progression:
- Step 1: The Foundation. Start with a clean price chart and basic Moving Averages (the 50 and 200-day). These establish the “big picture” direction and key support levels.
- Step 2: Momentum. Add one momentum oscillator, like the RSI or MACD. This helps you identify if the current move is overextended or just getting started.
- Step 3: The Filter. Layer in IV Rank. This is your most critical filter to ensure you aren’t overpaying for options during a volatility spike.
- Step 4: The Narrative. Check volume and macro sentiment to confirm the “story” behind the move. If the indicators say buy but volume is flat, the move lacks institutional conviction.
- Step 5: Execution. Once the signals align, execute with a disciplined position size. No indicator can save you from a trade that is too large for your account.
The “Rule of Three” for Confirmation
High-conviction trades usually require three independent signals to align. A price bounce off a moving average, a bullish MACD crossover, and a low IV Rank create a powerful trifecta for a long position. If only one or two signals are present, you’re gambling on a partial picture. When your indicators are shouting at each other with conflicting data, the smartest move is to stay out. This disciplined trading approach ensures that you only deploy capital when the mathematical odds are skewed heavily in your favor.
Customizing for Strategy Type
Your dashboard should shift based on your objective. If you’re hunting for income through covered calls or credit spreads, your primary focus must be IV Rank and Bollinger Bands to find overpriced premiums. For directional bets using long calls or puts, momentum indicators like the MACD and volume profiles take center stage to catch the meat of a move. If you’re hedging a portfolio, the VIX and Put/Call ratios become your most important thermometers. If your current setup feels cluttered or ineffective, a Virtual Portfolio Review can help you strip away the noise and focus on the data that actually moves the needle.
Join the Inner Circle: Moving Beyond Static Indicators
Indicators are just math on a screen. You can have the best indicators for options trading, but if you don’t know how to read the context, you’re just a person with a very expensive calculator. The real edge comes from interpretation. Think of it like a weather report; a barometer tells you the pressure is dropping, but a seasoned sailor knows exactly how that translates to the waves hitting the hull. In the 2026 market, where algorithmic noise is at an all-time high, the human element of discernment is your most valuable asset.
Phil Stock World members don’t just stare at charts in isolation. They use these tools to build and manage virtual portfolios, testing “Be the House” strategies in a collaborative environment. This isn’t about following a guru blindly. It’s about seeing how institutional-grade logic is applied to the same data everyone else sees. When you move from static signals to dynamic interpretation, you stop being the liquidity and start being the player.
The “best” indicator is ultimately the one between your ears. While we’ve discussed IV Rank and momentum oscillators, those are just inputs. The output is your decision-making process. Are you reacting to the chart out of fear, or are you responding to the data with a calculated plan? Joining a community of savvy traders helps bridge that gap, turning abstract numbers into actionable wealth-building strategies.
The Power of the Live Trading Room
There is a massive difference between reading about a strategy and seeing it executed in a live environment. In our community, we apply the best indicators for options trading to real-time 2026 market data as it unfolds. You get to see the nuances of entry and exit that a textbook simply can’t capture. It’s the transition from “learning the tools” to “executing the strategy” with a group of peers who are all focused on the same mathematical edge. Seeing how veteran traders react to a sudden VIX spike or a macro headline provides a level of education that static charts can’t match. Check out the live trading room for options for a deep dive into how we navigate today’s volatility.
Your Next Step: Strategy Audit
Be honest with yourself: is your current setup actually putting money in your pocket? If your dashboard is a mess of conflicting signals, you’re likely leaking capital through hesitation or poor risk pricing. A virtual portfolio review can identify these leaks and help you refine your approach for the current market cycle. It’s an opportunity to audit your strategy with a professional eye and ensure your indicators are working for you, not against you. Stop guessing and start measuring. Become a Phil Stock World member today and start trading with the confidence of the house.
Master the Mathematical Edge in 2026
Most traders spend their lives chasing shadows on a chart while the house quietly collects their premiums. You don’t have to be the one providing the liquidity anymore. We’ve explored how to identify overpriced volatility and how to build a simplified dashboard that prioritizes clarity over clutter. Using the best indicators for options trading means shifting your focus from guessing direction to measuring probability. It’s a fundamental change in perspective that transforms trading from a high-stakes gamble into a disciplined business.
If you’re ready to stop trading in a vacuum, it’s time to join a community backed by 20+ years of market-beating analysis. You’ll gain access to real-time trade alerts, an exclusive private community, and comprehensive educational webinars designed to sharpen your edge. Master the Market with a Phil Stock World Membership today and start executing trades based on data rather than hope. The market is always moving, but with the right tools, you’ll always be moving in the right direction.
Frequently Asked Questions
What is the absolute best indicator for options trading?
There isn’t a single “magic” indicator, but IV Rank is widely considered the most essential tool for any serious options trader. Unlike price-only tools, IV Rank tells you if the premium you’re paying is historically expensive or cheap. While the crowd focuses on moving averages, the pros use IV Rank to decide whether to buy or sell volatility. It’s about finding the mathematical edge rather than just guessing the next price move.
Can I trade options using only technical indicators?
You can, but it’s a dangerous game. Technical indicators like RSI or MACD only track price momentum and trend. They completely ignore the two biggest factors in options pricing: time decay and implied volatility. You might be right about the stock’s direction but still lose money because the option’s value evaporated. To succeed, you must balance technical signals with volatility metrics to ensure you aren’t overpaying for a position.
How does Implied Volatility (IV) affect which indicators I should use?
Implied Volatility dictates your entire strategy. When IV is high, you should lean toward “selling” indicators like Bollinger Bands and IV Rank to find credit spread opportunities. When IV is low, you look for momentum indicators to time long directional bets. Using the best indicators for options trading requires you to first check the VIX or IV Rank to see if you should be the insurance salesman or the policy buyer.
What is the difference between leading and lagging indicators for options?
Leading indicators like the Relative Strength Index (RSI) attempt to predict price reversals by measuring momentum. Lagging indicators, such as Moving Averages, confirm trends that have already started. Options traders need a mix of both. You use lagging indicators to identify the broad market trend and leading indicators to fine-tune your entry points. This combination helps you avoid jumping into a trade before the momentum has actually shifted in your favor.
How many indicators should a beginner use for options?
Beginners should stick to a “Rule of Three” to avoid analysis paralysis. A clean chart with one trend indicator, one momentum oscillator, and one volatility tool like IV Rank is plenty. Overloading your dashboard with five or six different signals usually leads to conflicting data and hesitation. Your goal is to keep the setup simple enough to execute trades with confidence while still having enough data to filter out bad entries.
Do indicators work differently for weekly options versus monthly options?
Indicators definitely work differently based on your timeframe. Weekly options are hyper-sensitive to short-term momentum and immediate volatility spikes; you might use shorter settings on your RSI or MACD to catch these moves. Monthly options are more influenced by broader daily trends and long-term support levels. Regardless of the expiration date, the core math of the “Be the House” strategy remains the same. You’re always looking for where the premium is mispriced.
Why do my indicators show a “buy” but my option is losing value?
This is the most common frustration for new traders. Your indicator might show a perfect “buy” signal for the stock, but your option is losing value because of time decay or a volatility crush. If you buy a call when volatility is at a peak, the premium will deflate as soon as the market calms down. This is why understanding the best indicators for options trading must include a deep dive into the Greeks and implied volatility.
How can I use indicators to trade like “The House”?
To trade like “The House,” you use indicators to identify when the herd is overpaying for insurance. This means looking for high IV Rank and price levels that sit outside one standard deviation. Instead of gambling on which way the stock will go, you sell the premium to the gamblers. You use tools like Bollinger Bands to find the edges of the bell curve and place your trades where the math says you’ll win.

