


Most traders treat technical charts like a crystal ball, but the real edge in 2026 isn’t about predicting the future; it’s about decoding the footprints of the smart money. If you’ve ever felt the sting of getting stopped out right before a massive move, you know that standard technical analysis for swing trading often feels like a trap. It’s exhausting to fight through information overload while mainstream media screams advice that usually leads to losses. You want a system that works, not a screen full of cluttered indicators that don’t offer a clear path forward.
It’s time to stop gambling and start acting like the house. We’re going to master the technical frameworks that separate high-probability swing trades from retail noise. You’ll learn how to leverage the 2026 elimination of the $25,000 PDT rule to your advantage, giving you the flexibility to exit trades when the data changes, not when a broker says so. This article provides a repeatable system for identifying 2-10 day trades with superior risk-to-reward ratios. We’re moving past the hype to build a strategy that gives you the confidence to trust the charts and finally ignore the distractions.
Key Takeaways
- Master a repeatable framework for technical analysis for swing trading that filters out market noise and focuses on high-probability 2 to 10 day setups.
- Simplify your charts by using the “Holy Trinity” of indicators, Trend, Momentum, and Volume, to avoid the paralysis of indicator overload.
- Learn to identify common chart patterns like Flags and Cup and Handles as psychological footprints of the herd rather than just random lines on a screen.
- Leverage the 2026 regulatory shift, including the elimination of the $25,000 PDT rule, to manage your positions with greater intraday flexibility.
- Discover why technical signals require real-time validation to help you transition from a retail gambler to a disciplined trader who thinks like “The House.”
Why Technical Analysis is the Swing Trader’s North Star
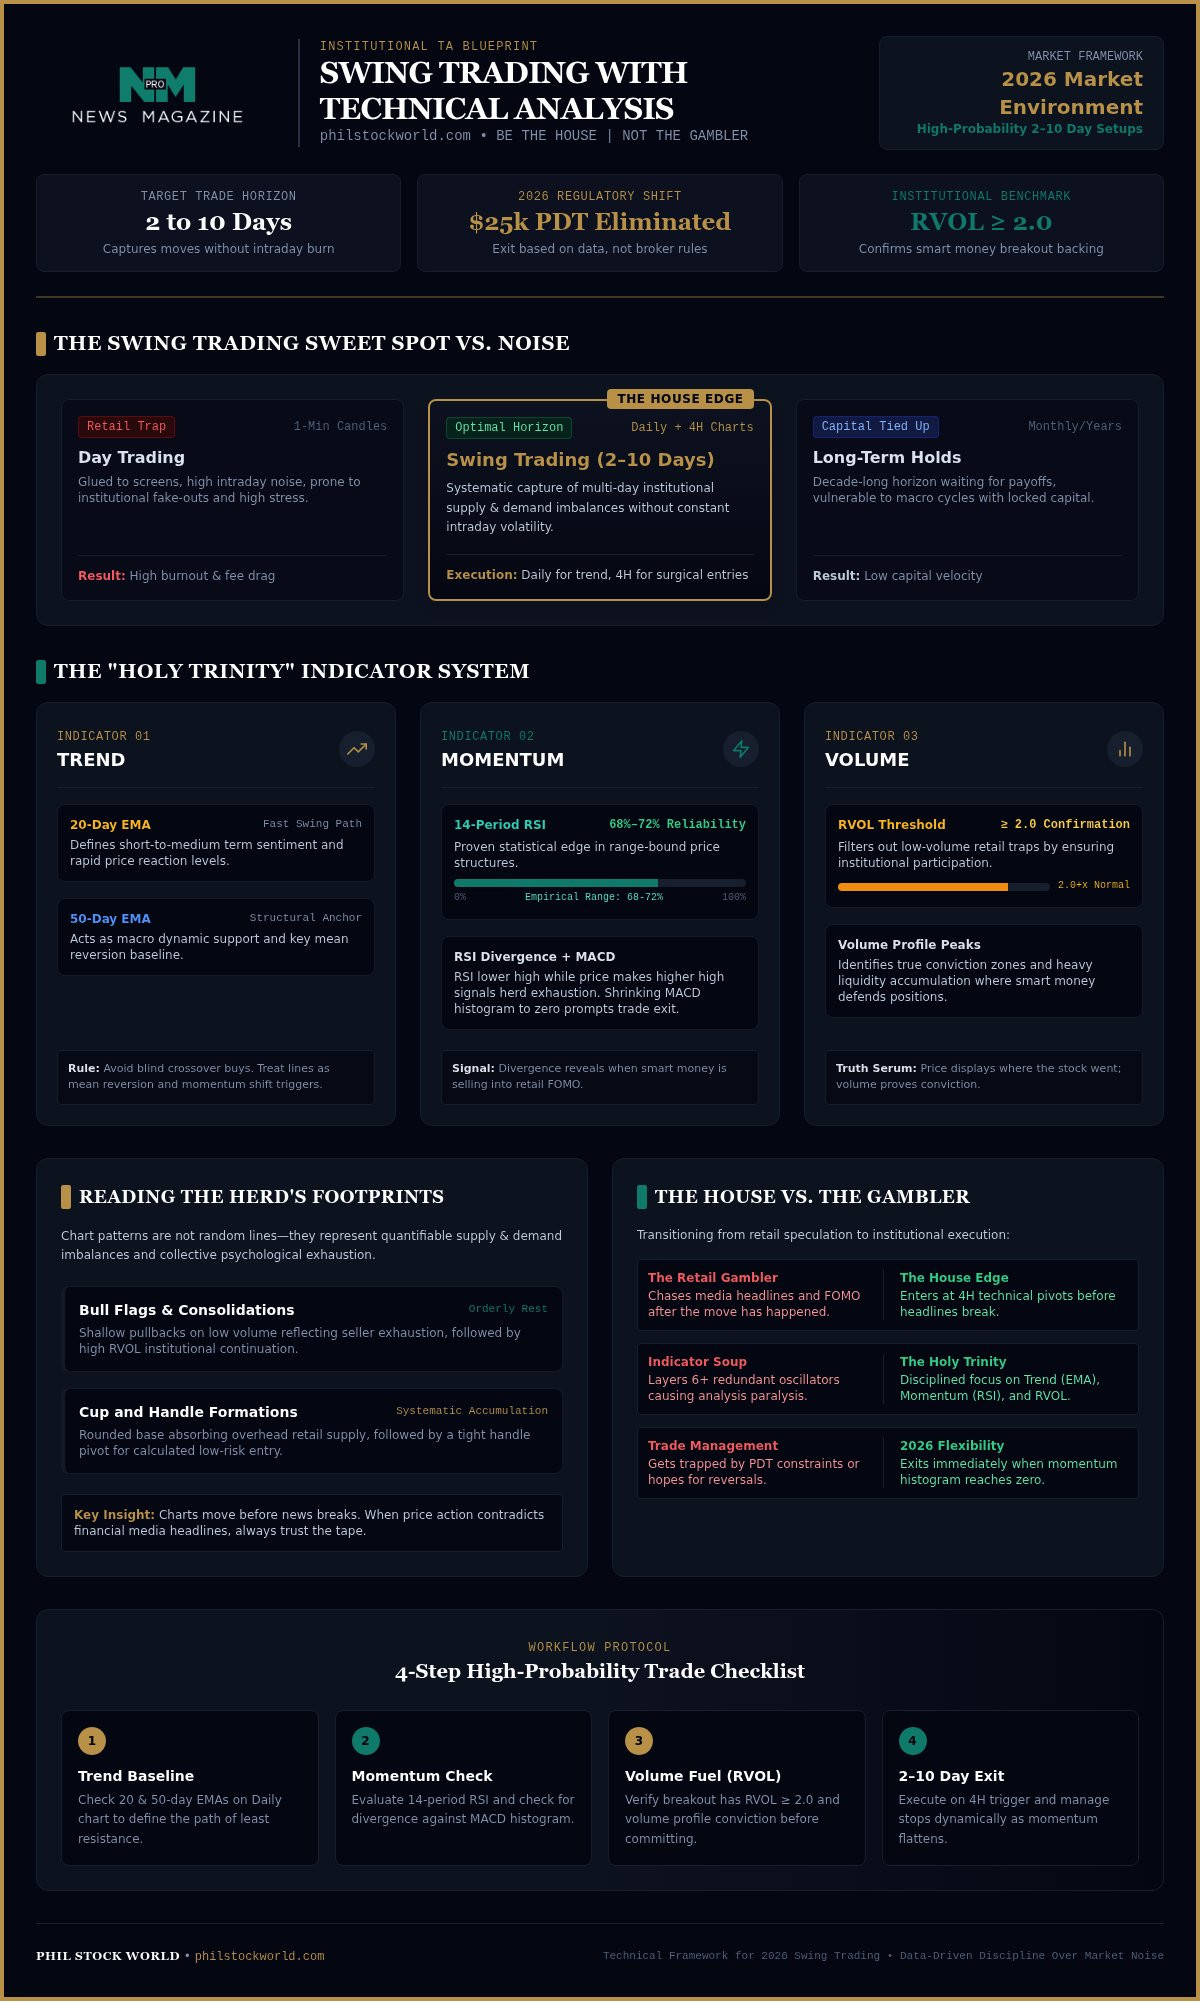
In the 2026 market, technical analysis for swing trading isn’t just about drawing lines on a screen; it’s about reading the collective psychology of the market. While day traders are glued to one minute candles and long term investors are waiting years for a payoff, swing traders operate in the 2 to 10 day sweet spot. This timeframe allows you to capture significant price moves without the stress of intraday volatility or the capital tie up of decade long holds. By using rule based swing trading strategies, you’re essentially mapping out supply and demand zones where the “smart money” is likely to step in.
Think of technical analysis as a map of the herd’s footprints. It isn’t a crystal ball or financial astrology. It’s a systematic way to identify where buyers are exhausted and where sellers are losing their grip. When you stop looking for “the next big thing” and start looking for repeatable price patterns, you move from being a gambler to being the house. You aren’t guessing where the market goes; you’re reacting to where the money is already flowing.
The Three Pillars of Swing Trading TA
Success starts with three non negotiable elements that provide a foundation for every trade. First, price action is the only absolute truth in a noisy market. Every headline, rumor, and earnings report is eventually baked into the price. Second, volume acts as the fuel for any move. In 2026, we look for a Relative Volume (RVOL) of 2.0 or higher to confirm that institutional players are actually backing a breakout. Finally, timeframes matter. While the daily chart shows the overall trend, the 4 hour chart provides the surgical precision needed for entries. These higher timeframes filter out the “fake outs” that often ruin day traders who get caught in the noise.
Technical Analysis vs. Fundamental Noise
The charts almost always move before the news breaks. By the time a talking head on financial media explains why a stock is up, the “house” has already entered the position. Instead of chasing headlines, savvy traders use macro market insights to gauge the broader sentiment and then let the charts trigger the trade. If the price action contradicts the news, trust the price. The tape doesn’t lie, even when the media does. This approach turns technical analysis for swing trading from a guessing game into a methodical hunt for high probability setups that the retail crowd usually misses until it’s too late.
The Holy Trinity of Indicators: Momentum, Trend, and Volume
Too many traders drown in “Indicator Soup.” They think layering six different oscillators will give them a clearer picture, but it usually just leads to analysis paralysis. According to empirical research on technical analysis, certain chart patterns and indicators do provide a statistical edge, but only when used with discipline. For technical analysis for swing trading, you need to strip the clutter and focus on the “Holy Trinity” of Trend, Momentum, and Volume. These three categories provide a non-correlated view of the market, ensuring you aren’t just looking at the same data in three different colors.
Mastering Moving Averages for Swing Entries
Trend is your baseline. We use the 20-day and 50-day Exponential Moving Averages (EMAs) to define the medium term path of a stock. The 20-day EMA represents the fast swing sentiment, while the 50-day acts as structural support. When price stretches too far from these lines, it’s often a mean reversion opportunity. Don’t buy a crossover blindly. Use it as a confirmation that the momentum shift has already begun. If you’re looking for real time validation of these levels, real-time market analysis can help you align your positions with the dominant trend.
RSI and MACD: Decoding Market Exhaustion
Momentum tells you if the trend has legs or if it’s running on fumes. The standard 14-period RSI carries a reliability rate of approximately 68% to 72% in range-bound structures, but its real power lies in spotting disconnects. RSI divergence is the ultimate “herd exhaustion” signal that warns you a reversal is imminent. When price makes a higher high but the RSI makes a lower high, the “house” is likely selling into retail FOMO. Pair this with MACD histograms. When those bars start shrinking toward the zero line, it’s your cue to tighten stops or exit the trade before the momentum fully evaporates.
Volume is the final piece of the puzzle. It’s the truth serum of the market. While price action shows you where the stock went, volume tells you how much conviction was behind the move. We look for Volume Profile peaks to identify where institutional “big money” is actually transacting. If a breakout happens on thin volume, it’s a trap. A Relative Volume (RVOL) of 2.0 or higher is the statistical benchmark we use to validate institutional sponsorship. When you see that surge alongside a technical breakout, you have the green light to stay in the trade for a 2 to 10 day move.
Reading the Herd: High-Probability Chart Patterns
Chart patterns are often sold as simple geometry, but they’re actually psychological traps for the unwary. When you look at a chart, you’re looking at a history of where people lost money or got greedy. Understanding the mechanics of swing trading means recognizing that these shapes are battlegrounds. Support isn’t just a horizontal line; it’s a floor where buyers have historically felt “cheap” enough to step in. Resistance is the ceiling where the “house” starts taking profits. In 2026, algorithmic liquidity hunting has made these levels messier, but the core human behavior remains the same. The tape doesn’t lie. It records every panic, every squeeze, and every moment of greed.
One of the most powerful tools in technical analysis for swing trading is the failed breakout. When a stock pops above a clear resistance level and immediately slams back down, it’s a “bull trap.” The retail herd is trapped, and their forced selling provides the fuel for a massive move in the opposite direction. Learning to trade the failure is often more profitable than trading the success. You aren’t just looking for what works; you’re looking for where the rest of the market is wrong.
Continuation Patterns for Trend Following
Continuation patterns like Bull and Bear flags are essentially the market taking a breather. You want to see price consolidate on low volume after a sharp move. This shows that the sellers are exhausted and the trend is ready to resume. To get an edge, you must learn how to read market charts to see these flags forming before the rest of the world notices. Ascending triangles are another favorite; they signal that buyers are getting more aggressive, pushing higher lows against a flat ceiling until the pressure finally pops. These setups are the bread and butter of a 2 to 10 day swing strategy.
Reversal Patterns: Catching the Knife Safely
Catching a falling knife is dangerous unless you wait for a floor to form. Double bottoms, or “W” formations, show that the market has tested a low twice and found buyers both times. Conversely, the Head and Shoulders pattern is a classic reversal signal, though retail traders often get it wrong by entering before the “neckline” actually breaks. Instead of guessing, wait for candlestick triggers like a Hammer at support or a Doji at the top of a run. These small signals are the final confirmation that the herd is changing its mind, allowing you to enter with a tight stop and a high win rate.
Building a Repeatable Swing Trading System
Execution is where most traders fail. You can have the best indicators, but without a repeatable process, you’re just clicking buttons and hoping for the best. A professional system for technical analysis for swing trading relies on a four step checklist. First, scan for stocks showing high relative strength against the S&P 500. You want the leaders, not the laggards. Second, identify if you’re playing a trend continuation or a reversal. Third, define your invalidation point. This is the exact price where your thesis is proven wrong. Finally, calculate your position size based on that risk, ensuring no single trade can wreck your account.
Scanning for these opportunities requires strict criteria. In the 2026 market, we look for stocks with an Average Daily Volume (ADV) greater than 500,000 shares and a market cap above $300 million to ensure liquidity. Using screeners to find a Relative Volume (RVOL) of 2.0 or higher helps identify where institutional sponsorship is entering. This data driven approach removes the emotional guesswork that plagues retail traders. You aren’t chasing every green candle; you’re waiting for the market to meet your specific requirements.
Risk Management: Trading Like “The House”
The “House” always wins because it manages risk better than the gambler. We follow the 1% Rule, which means you never risk more than 1% of your total capital on any single setup. If your stop loss is hit, it’s just a small cost of doing business. Use Fibonacci extensions to set realistic profit targets rather than picking numbers out of the air. If you find yourself consistently hitting stops or missing targets, virtual portfolio reviews are a vital way to audit your strategy and find the leaks in your boat. It’s about staying in the game long enough for the math to work in your favor.
The Swing Trader’s Daily Routine
Consistency starts before the opening bell. Your pre market routine should involve scanning for gaps and news catalysts that align with your technical levels. Following the elimination of the $25,000 PDT rule in June 2026, you now have the flexibility to cut losing swing positions intraday without fear of broker penalties. Once you’re in a trade, manage the position methodically. Move your stop to break even only after the price has moved significantly in your favor, giving the stock room to breathe. The most important part of the day is the post trade audit. Review your wins and losses with total transparency. You’ll learn far more from a well executed loss than a lucky win. To refine your daily execution and stay ahead of the curve, join our Live Trading Room to interpret charts in real-time.
Beyond the Charts: The Phil Stock World Edge
Technical analysis for swing trading isn’t a solitary pursuit; it’s a high-stakes puzzle best solved with institutional-grade insight. While you can draw lines on a chart all day, the real magic happens when you validate those setups with a community that understands market mechanics. Joining the Phil Stock World membership provides that crucial second opinion. We move beyond the retail herd by looking for the underlying supply and demand shifts that indicators alone might miss. It’s about transforming a lonely screen-watching habit into a collaborative strategic discussion.
Our “Be the House” philosophy takes your technical signals and adds a layer of professional probability. Instead of just buying a stock because a candle looks pretty, we use those chart levels to identify where to sell options premium. If a stock hits a major support zone you found via technical analysis for swing trading, we look to build asymmetric trades. We might sell a cash-secured put or use a vertical spread to capitalize on time decay. This way, you aren’t just betting on a price move; you’re building a business model where the odds are stacked in your favor.
Live Trading and Real-Time Feedback
Moving from static charts to interactive trading is where the theory meets the reality of the tape. Many specialized research platforms offer delayed analysis, but our Live Trading Room identifies “The House” setups as they are forming. You get to see how veteran analysts react to sudden news or liquidity hunts in real-time. This feedback loop is essential for refining your timing and building the confidence to pull the trigger on high-probability setups without the usual retail hesitation.
Taking the Next Step in Your Trading Journey
You now have the technical foundation to identify high-probability swing trades, from the Holy Trinity of indicators to the psychological maps of the herd. However, the most successful traders never stop learning. We invite you to step inside our private trading room and see how these technical frameworks are used to manage a virtual portfolio in the real world. You’ll find a group of professional-grade investors who prioritize transparency and actionable data over mainstream hype. Discipline beats brilliance every time.
Mastering the 2026 Market Tape
The days of guessing on retail breakouts are over. You’ve seen how the “Holy Trinity” of indicators filters out the noise and why reading the herd’s psychological footprints is the only way to avoid the traps set by algorithmic hunters. By applying a repeatable system and sticking to the 1% risk rule, you’re no longer just a gambler; you’re operating with the discipline of the house. Mastering technical analysis for swing trading isn’t about being right 100% of the time. It’s about having a probabilistic edge that works while the rest of the market panics.
Ready to stop trading in a vacuum? You don’t have to navigate the 2026 volatility alone. Join the Phil Stock World Live Trading Room for real-time technical analysis and “The House” strategies. You’ll get daily market commentary from Phil Davis, real-time trade alerts for stocks and options, and access to a community of professional-grade independent investors who prioritize clarity over hype.
The charts are waiting. It’s time to trust your framework, manage your risk, and start taking your cut from the market with confidence.
Frequently Asked Questions
What is the best timeframe for technical analysis in swing trading?
The Daily and 4-hour charts are the gold standard for this style. You use the Daily chart to establish the primary trend and major support or resistance levels. The 4-hour chart provides the granularity needed to time your entry without the chaotic noise of the 1-minute or 5-minute candles. This multi-timeframe approach ensures you aren’t fighting the larger market tide while looking for a precise 2 to 10 day move.
Is technical analysis more important than fundamental analysis for swing traders?
Technical analysis handles the “when,” while fundamental analysis handles the “what.” You want to trade companies with solid macro valuations, but the chart tells you exactly when the herd is ready to move. At Phil Stock World, we believe in using technicals to time entries into fundamentally sound setups. This synergy helps you avoid holding a “great company” that’s stuck in a brutal technical downtrend for months.
How many indicators should I use for a swing trading strategy?
Stick to two or three non-correlated indicators to avoid analysis paralysis. A solid setup for technical analysis for swing trading usually includes one trend indicator like a 50-day EMA, one momentum oscillator like the RSI, and a volume metric. Using more than that leads to “Indicator Soup,” where conflicting signals keep you on the sidelines. Your goal is clarity, not a screen so cluttered you can’t see the actual price action.
Can I use technical analysis for swing trading options?
Technical analysis is actually more effective when paired with options. You use chart levels to pick your strikes and expiration dates, allowing you to sell premium or buy spreads at high-probability turning points. Instead of just betting on a stock going up, you can use technical support to sell a put spread, which gives you a margin of safety. It transforms a simple directional bet into a professional “House” strategy.
What is the most reliable chart pattern for swing trading?
Continuation patterns like the Bull Flag and the Cup and Handle are statistically the most reliable. These shapes show the market taking a necessary breather before resuming a dominant trend. While reversal patterns like the Double Bottom are tempting, they carry higher risk because you’re fighting existing momentum. Focus on flags that form on low volume after a high-volume surge; they offer the cleanest risk-to-reward ratios for a typical swing hold.
How do I avoid “fake-outs” when trading technical breakouts?
You avoid fake-outs by demanding institutional confirmation through volume. Never buy a breakout on thin trading activity. In 2026, we look for a Relative Volume (RVOL) of 2.0 or higher to prove the big money is participating. Waiting for a “retest” of the breakout level is another pro move. If the stock holds the old resistance as new support, the breakout is valid. If it slams back down, you’ve avoided a trap.
Do I need expensive software to perform professional technical analysis?
You don’t need a five-figure software suite to find an edge. Most modern brokers provide excellent charting tools for free, and platforms like Finviz offer professional-grade screening for under $40 a month. Your success depends on your ability to interpret data, not the price of your monitors. Spend your capital on your trades and your education rather than on flashy software that claims to predict the future with black-box algorithms.
How much capital do I need to start swing trading with technical analysis?
Following the elimination of the legacy $25,000 PDT rule on June 4, 2026, you can start with much less. While a $2,000 minimum is standard for margin accounts, your focus should be on position sizing rather than the total balance. Effective technical analysis for swing trading allows you to manage risk on smaller accounts by using options or liquid ETFs. Just ensure you aren’t risking more than 1% of your total capital on any single trade.

